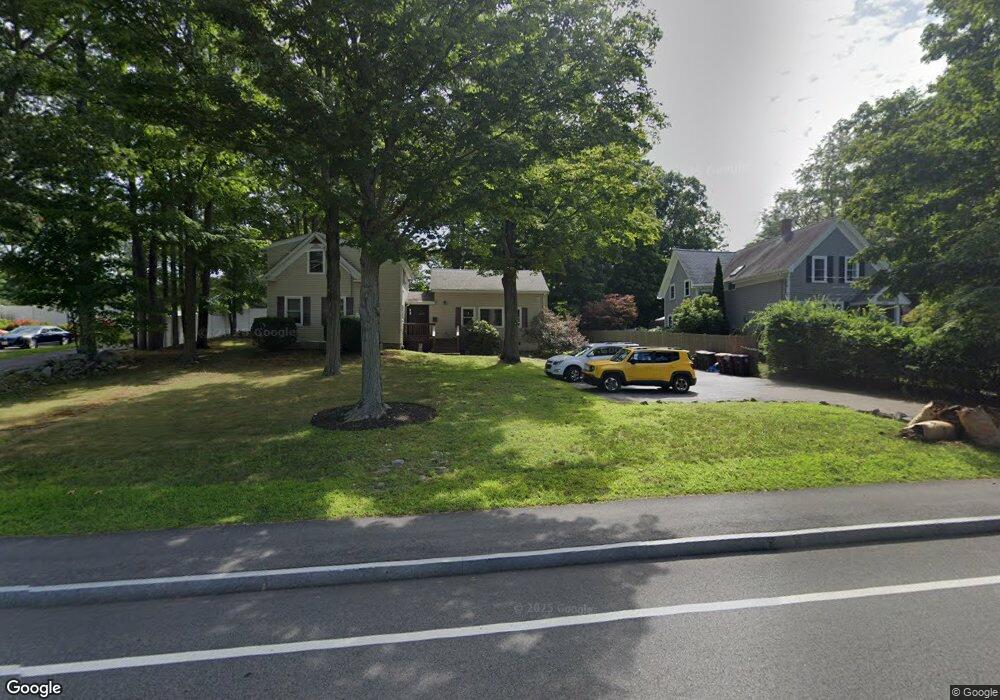
474 Summer St Weymouth, MA 02188
South Weymouth NeighborhoodEstimated Value: $694,548 - $794,000
4
Beds
3
Baths
2,108
Sq Ft
$356/Sq Ft
Est. Value
About This Home
This home is located at 474 Summer St, Weymouth, MA 02188 and is currently estimated at $751,387, approximately $356 per square foot. 474 Summer St is a home located in Norfolk County with nearby schools including Frederick C Murphy, Abigail Adams Middle School, and Weymouth Middle School Chapman.
Ownership History
Date
Name
Owned For
Owner Type
Purchase Details
Closed on
Oct 3, 2007
Sold by
Silva-Primo Flavia A
Bought by
Kilroy Stacey E
Current Estimated Value
Home Financials for this Owner
Home Financials are based on the most recent Mortgage that was taken out on this home.
Original Mortgage
$356,250
Outstanding Balance
$226,812
Interest Rate
6.59%
Mortgage Type
Purchase Money Mortgage
Estimated Equity
$524,575
Purchase Details
Closed on
Sep 3, 2004
Sold by
Sebaaly Andre S and Salem Antoine
Bought by
Silva-Primo Flavia A
Home Financials for this Owner
Home Financials are based on the most recent Mortgage that was taken out on this home.
Original Mortgage
$385,600
Interest Rate
6.01%
Mortgage Type
Purchase Money Mortgage
Purchase Details
Closed on
Nov 25, 2003
Sold by
Moores James M and Moores Sandra A
Bought by
Salem Antonie and Sebaaly Andre S
Home Financials for this Owner
Home Financials are based on the most recent Mortgage that was taken out on this home.
Original Mortgage
$220,500
Interest Rate
5.98%
Mortgage Type
Purchase Money Mortgage
Create a Home Valuation Report for This Property
The Home Valuation Report is an in-depth analysis detailing your home's value as well as a comparison with similar homes in the area
Home Values in the Area
Average Home Value in this Area
Purchase History
| Date | Buyer | Sale Price | Title Company |
|---|---|---|---|
| Kilroy Stacey E | $375,000 | -- | |
| Silva-Primo Flavia A | $482,000 | -- | |
| Salem Antonie | $245,000 | -- |
Source: Public Records
Mortgage History
| Date | Status | Borrower | Loan Amount |
|---|---|---|---|
| Open | Kilroy Stacey E | $356,250 | |
| Previous Owner | Silva-Primo Flavia A | $385,600 | |
| Previous Owner | Silva-Primo Flavia A | $96,400 | |
| Previous Owner | Salem Antonie | $220,500 |
Source: Public Records
Tax History Compared to Growth
Tax History
| Year | Tax Paid | Tax Assessment Tax Assessment Total Assessment is a certain percentage of the fair market value that is determined by local assessors to be the total taxable value of land and additions on the property. | Land | Improvement |
|---|---|---|---|---|
| 2025 | $5,466 | $541,200 | $216,300 | $324,900 |
| 2024 | $5,282 | $514,300 | $206,000 | $308,300 |
| 2023 | $5,255 | $502,900 | $190,700 | $312,200 |
| 2022 | $5,112 | $446,100 | $176,600 | $269,500 |
| 2021 | $4,816 | $410,200 | $176,600 | $233,600 |
| 2020 | $4,625 | $388,000 | $176,600 | $211,400 |
| 2019 | $4,512 | $372,300 | $169,800 | $202,500 |
| 2018 | $4,368 | $349,400 | $161,700 | $187,700 |
| 2017 | $4,165 | $325,100 | $154,100 | $171,000 |
| 2016 | $4,001 | $312,600 | $148,100 | $164,500 |
| 2015 | $3,843 | $297,900 | $148,100 | $149,800 |
| 2014 | $3,681 | $276,800 | $137,900 | $138,900 |
Source: Public Records
Map
Nearby Homes
- 116 Belmont St
- 501 Commerce Dr Unit 2310
- 501 Commerce Dr Unit 1111
- 501 Commerce Dr Unit 4206
- 501 Commerce Dr Unit 4308
- 501 Commerce Dr Unit 4306
- 200 Justin Dr Unit 3
- 655 Summer St
- 255 West St
- 262 West St
- 48 Apple Tree Ln
- 432 Grove St
- 92 Mercury St
- 441 Grove St
- 54 Federal St
- 67 Abby Rd
- 24 Blake Rd
- 972 Liberty St
- 2 Tara Dr Unit 1
- 33 Congress St