Estimated Value: $504,000 - $519,000
--
Bed
--
Bath
1,393
Sq Ft
$366/Sq Ft
Est. Value
About This Home
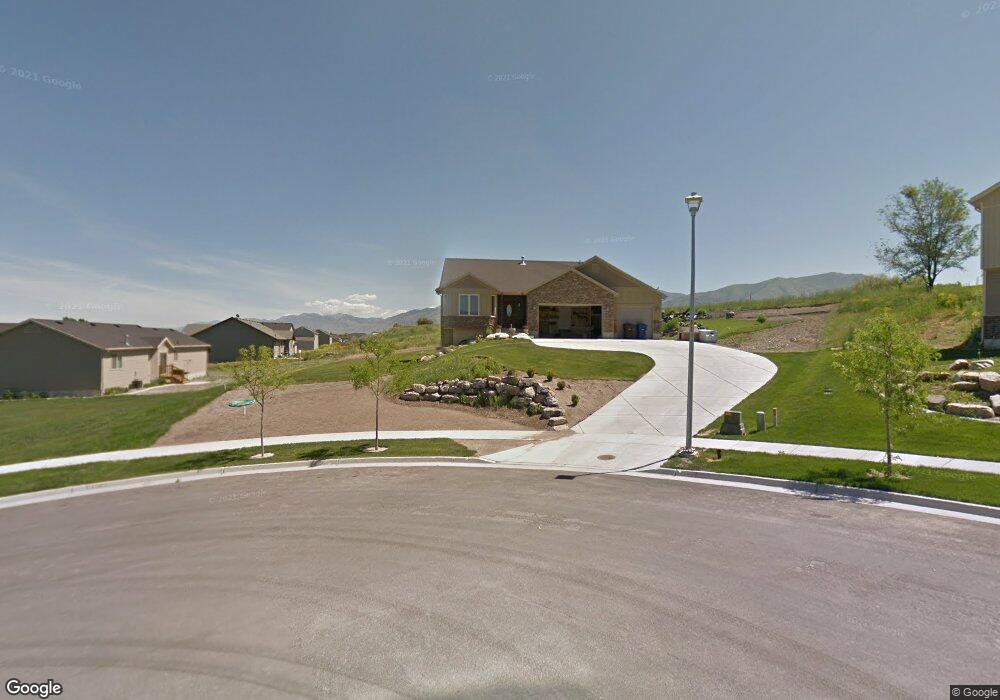
This home is located at 474 W 20 N Unit 9, Hyrum, UT 84319 and is currently estimated at $510,279, approximately $366 per square foot. 474 W 20 N Unit 9 is a home located in Cache County with nearby schools including Lincoln School, South Cache Middle School, and Mountain Crest High School.
Ownership History
Date
Name
Owned For
Owner Type
Purchase Details
Closed on
Jul 13, 2020
Sold by
South Cache Land Company Llc
Bought by
J Whit Properties Llc
Current Estimated Value
Home Financials for this Owner
Home Financials are based on the most recent Mortgage that was taken out on this home.
Original Mortgage
$1,963,260
Outstanding Balance
$1,737,003
Interest Rate
3.1%
Mortgage Type
Construction
Estimated Equity
-$1,226,724
Purchase Details
Closed on
Apr 17, 2020
Sold by
South Cache Land Company Llc
Bought by
Cbo Enterprises Llc
Home Financials for this Owner
Home Financials are based on the most recent Mortgage that was taken out on this home.
Original Mortgage
$1,147,500
Interest Rate
3.2%
Mortgage Type
Construction
Purchase Details
Closed on
Dec 31, 2008
Sold by
South Cache Subdivision Llc
Bought by
Panter Mark
Create a Home Valuation Report for This Property
The Home Valuation Report is an in-depth analysis detailing your home's value as well as a comparison with similar homes in the area
Home Values in the Area
Average Home Value in this Area
Purchase History
| Date | Buyer | Sale Price | Title Company |
|---|---|---|---|
| J Whit Properties Llc | -- | Hickman Land Title Logan | |
| Cbo Enterprises Llc | -- | Hickman Land Title Logan | |
| Panter Mark | -- | Advanced Title |
Source: Public Records
Mortgage History
| Date | Status | Borrower | Loan Amount |
|---|---|---|---|
| Open | J Whit Properties Llc | $1,963,260 | |
| Previous Owner | Cbo Enterprises Llc | $1,147,500 |
Source: Public Records
Tax History Compared to Growth
Tax History
| Year | Tax Paid | Tax Assessment Tax Assessment Total Assessment is a certain percentage of the fair market value that is determined by local assessors to be the total taxable value of land and additions on the property. | Land | Improvement |
|---|---|---|---|---|
| 2025 | $2,024 | $290,575 | $0 | $0 |
| 2024 | $2,002 | $268,395 | $0 | $0 |
| 2023 | $2,066 | $264,935 | $0 | $0 |
| 2022 | $2,157 | $264,935 | $0 | $0 |
| 2021 | $1,800 | $340,669 | $87,500 | $253,169 |
| 2020 | $1,732 | $307,647 | $87,500 | $220,147 |
| 2019 | $1,625 | $271,457 | $51,310 | $220,147 |
| 2018 | $1,535 | $247,870 | $51,310 | $196,560 |
| 2017 | $1,565 | $131,180 | $0 | $0 |
| 2016 | $1,601 | $107,325 | $0 | $0 |
| 2015 | $1,313 | $107,325 | $0 | $0 |
| 2014 | $1,267 | $105,945 | $0 | $0 |
| 2013 | -- | $105,945 | $0 | $0 |
Source: Public Records
Map
Nearby Homes
- 22 N 500 W
- 457 W 20 N Unit 10
- 457 W 20 N
- 36 N 500 W Unit 7
- 36 N 500 W
- 471 W 20 N Unit 11
- 488 W 20 N Unit 8
- 485 W 20 N Unit 12
- 50 N 500 W Unit 6
- 50 N 500 W Unit LOT 6
- 50 N 500 W
- 514 W 20 N Unit 16
- 33 N 500 W Unit 15
- 33 N 500 W
- 45 N 500 W Unit 14
- 45 N 500 W
- 5 N 500 W Unit 13
- 15 N 500 W
- 64 N 500 W
- 64 N 500 W Unit 5