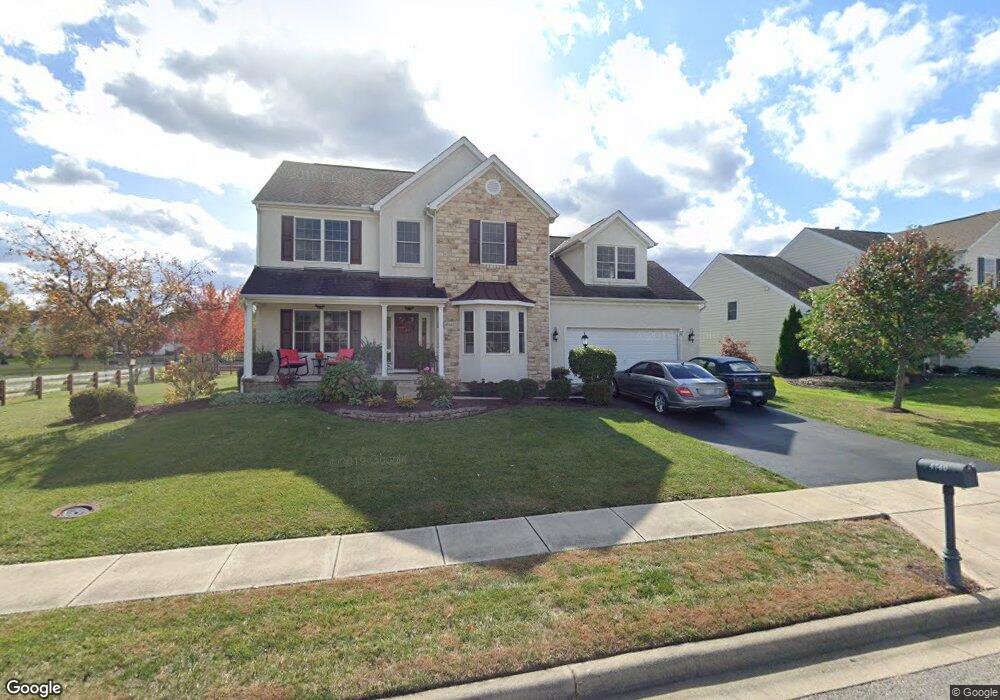
4740 Chimera Loop Unit 7012 Galena, OH 43021
Genoa NeighborhoodEstimated Value: $603,000 - $623,000
4
Beds
3
Baths
3,272
Sq Ft
$188/Sq Ft
Est. Value
About This Home
This home is located at 4740 Chimera Loop Unit 7012, Galena, OH 43021 and is currently estimated at $614,353, approximately $187 per square foot. 4740 Chimera Loop Unit 7012 is a home located in Delaware County with nearby schools including Big Walnut Elementary School, Big Walnut Intermediate School, and Big Walnut Middle School.
Ownership History
Date
Name
Owned For
Owner Type
Purchase Details
Closed on
Mar 4, 2021
Sold by
Sharpe David R and Sharpe Joann M
Bought by
Mccormick Cody M and Mccormick Brooke E
Current Estimated Value
Home Financials for this Owner
Home Financials are based on the most recent Mortgage that was taken out on this home.
Original Mortgage
$413,250
Outstanding Balance
$370,449
Interest Rate
2.7%
Mortgage Type
New Conventional
Estimated Equity
$243,904
Purchase Details
Closed on
Jun 6, 2005
Sold by
Dominion Homes Inc
Bought by
Sharpe David R and Sharpe Joann M
Home Financials for this Owner
Home Financials are based on the most recent Mortgage that was taken out on this home.
Original Mortgage
$277,380
Interest Rate
4.12%
Mortgage Type
New Conventional
Create a Home Valuation Report for This Property
The Home Valuation Report is an in-depth analysis detailing your home's value as well as a comparison with similar homes in the area
Home Values in the Area
Average Home Value in this Area
Purchase History
| Date | Buyer | Sale Price | Title Company |
|---|---|---|---|
| Mccormick Cody M | $437,000 | Great American Title Agency | |
| Sharpe David R | $346,800 | Alliance Title |
Source: Public Records
Mortgage History
| Date | Status | Borrower | Loan Amount |
|---|---|---|---|
| Open | Mccormick Cody M | $413,250 | |
| Previous Owner | Sharpe David R | $277,380 | |
| Closed | Sharpe David R | $17,336 |
Source: Public Records
Tax History Compared to Growth
Tax History
| Year | Tax Paid | Tax Assessment Tax Assessment Total Assessment is a certain percentage of the fair market value that is determined by local assessors to be the total taxable value of land and additions on the property. | Land | Improvement |
|---|---|---|---|---|
| 2024 | $7,100 | $158,170 | $36,930 | $121,240 |
| 2023 | $6,996 | $158,170 | $36,930 | $121,240 |
| 2022 | $6,530 | $126,390 | $25,730 | $100,660 |
| 2021 | $6,708 | $126,390 | $25,730 | $100,660 |
| 2020 | $6,726 | $126,390 | $25,730 | $100,660 |
| 2019 | $6,651 | $119,810 | $25,730 | $94,080 |
| 2018 | $6,197 | $119,810 | $25,730 | $94,080 |
| 2017 | $5,784 | $116,620 | $23,170 | $93,450 |
| 2016 | $5,690 | $116,620 | $23,170 | $93,450 |
| 2015 | $5,720 | $116,620 | $23,170 | $93,450 |
| 2014 | $5,754 | $116,620 | $23,170 | $93,450 |
| 2013 | $5,957 | $113,890 | $23,170 | $90,720 |
Source: Public Records
Map
Nearby Homes
- 7912 Mariposa Dr
- 5015 Bespoke Ct
- 7216 Big Walnut Rd
- 7923 Big Walnut Rd
- 8216 W Shore Dr
- 7969 Linksview Cir Unit 7969
- 7441 Lewis Center Rd
- 5279 Slater Ridge
- 5611 Genoa Farms Blvd
- 5462 Ketterington Ln
- 5349 Slater Ridge Unit 5349
- 6401 Big Walnut Rd
- 6178 Garden
- 6398 Garden Loop
- 6192 Garden Loop
- 6384 Garden Loop
- 6206 Garden Loop
- 7996 Thornbush Dr
- 7546 Upper Cambridge Way
- 6428 Fox Hollow Dr
- 4740 Chimera Loop
- 4726 Chimera Loop
- 4726 Chimera Loop Unit 7011
- 4768 Chimera Loop
- 4720 Chimera Loop
- 4780 Chimera Loop
- 4714 Chimera Loop
- 7553 Presidium Loop
- 7540 Marrisey Loop
- 7533 Presidium Loop
- 4786 Chimera Loop
- 7512 Marrisey Loop
- 7525 Presidium Loop
- 7605 Presidium Loop
- 7599 Marrisey Loop
- 4667 Chimera Loop
- 4792 Chimera Loop
- 7617 Marrisey Loop
- 7488 Marrisey Loop
- 0 Presidium Loop