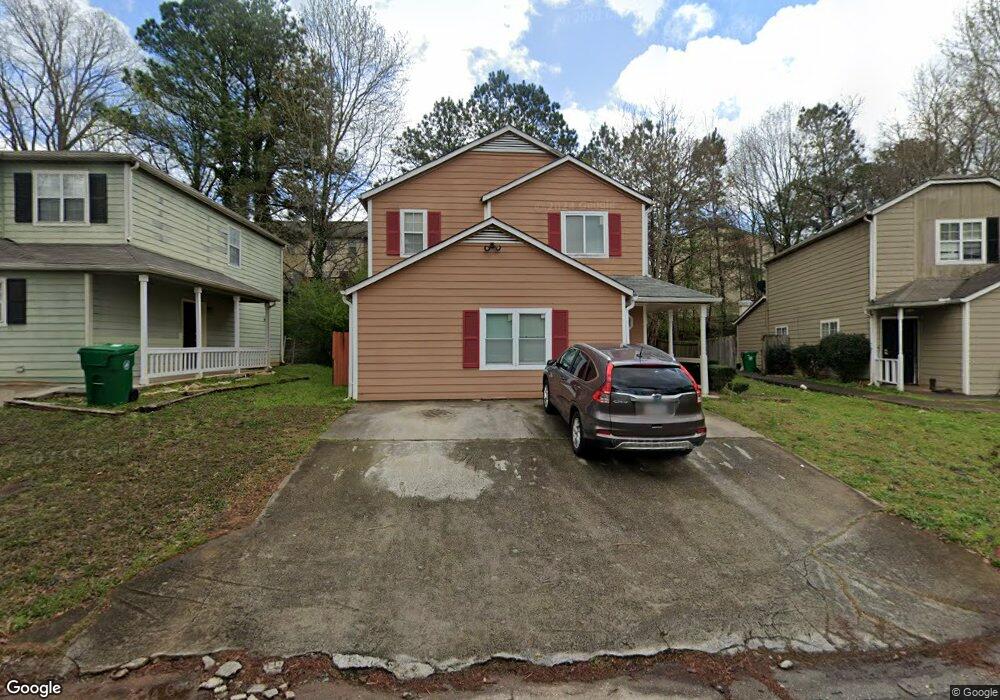
4742 Cedar Park Way Stone Mountain, GA 30083
Estimated Value: $247,000 - $281,000
3
Beds
3
Baths
1,590
Sq Ft
$171/Sq Ft
Est. Value
About This Home
This home is located at 4742 Cedar Park Way, Stone Mountain, GA 30083 and is currently estimated at $271,934, approximately $171 per square foot. 4742 Cedar Park Way is a home located in DeKalb County with nearby schools including Hambrick Elementary School, Stone Mountain Middle School, and Stone Mountain High School.
Ownership History
Date
Name
Owned For
Owner Type
Purchase Details
Closed on
Jan 24, 2020
Sold by
Hamid Mohamed
Bought by
Mohamed Misbah Abdulatif
Current Estimated Value
Purchase Details
Closed on
May 7, 2010
Sold by
Salih Sofia
Bought by
Hamid Mohamed I and Hamid Saada I
Purchase Details
Closed on
Mar 31, 2010
Sold by
Federal Natl Mtg Assn Fnma
Bought by
Salih Sofia
Purchase Details
Closed on
Feb 2, 2010
Sold by
Chase Hm Fin Llc
Bought by
Federal Natl Mtg Assn Fnma
Purchase Details
Closed on
Nov 18, 2005
Sold by
Reeves Vivian and Reeves Lakendra
Bought by
Gray Rickey B and Gray Debora L
Home Financials for this Owner
Home Financials are based on the most recent Mortgage that was taken out on this home.
Original Mortgage
$76,500
Interest Rate
6.04%
Mortgage Type
New Conventional
Purchase Details
Closed on
Aug 6, 1996
Sold by
Regions Mtg Inc
Bought by
Secretary Of Hud
Create a Home Valuation Report for This Property
The Home Valuation Report is an in-depth analysis detailing your home's value as well as a comparison with similar homes in the area
Home Values in the Area
Average Home Value in this Area
Purchase History
| Date | Buyer | Sale Price | Title Company |
|---|---|---|---|
| Mohamed Misbah Abdulatif | -- | -- | |
| Hamid Mohamed I | -- | -- | |
| Salih Sofia | -- | -- | |
| Federal Natl Mtg Assn Fnma | -- | -- | |
| Chase Hm Fin Llc | $67,562 | -- | |
| Gray Rickey B | $85,000 | -- | |
| Secretary Of Hud | -- | -- | |
| Regions Mtg | $81,120 | -- |
Source: Public Records
Mortgage History
| Date | Status | Borrower | Loan Amount |
|---|---|---|---|
| Previous Owner | Gray Rickey B | $76,500 |
Source: Public Records
Tax History Compared to Growth
Tax History
| Year | Tax Paid | Tax Assessment Tax Assessment Total Assessment is a certain percentage of the fair market value that is determined by local assessors to be the total taxable value of land and additions on the property. | Land | Improvement |
|---|---|---|---|---|
| 2024 | $2,989 | $100,280 | $24,000 | $76,280 |
| 2023 | $2,989 | $96,080 | $24,000 | $72,080 |
| 2022 | $2,631 | $87,600 | $14,200 | $73,400 |
| 2021 | $2,996 | $61,120 | $14,200 | $46,920 |
| 2020 | $1,734 | $59,640 | $14,200 | $45,440 |
| 2019 | $1,398 | $45,640 | $14,200 | $31,440 |
| 2018 | $1,032 | $39,800 | $5,280 | $34,520 |
| 2017 | $960 | $29,680 | $5,342 | $24,338 |
| 2016 | $938 | $29,680 | $5,342 | $24,338 |
| 2014 | $680 | $29,680 | $5,280 | $24,400 |
Source: Public Records
Map
Nearby Homes
- 1462 Knights Trail
- 4706 Cedar Park Trail
- 4685 Cedar Park Trail
- 4842 Hairston Park Square
- 1251 Kelton Dr
- 1169 Oaks Place
- 4495 Mountain Ash Dr Unit 12
- 1191 Demere Dr
- 4762 Old Highgate Entry
- 1097 Old Saybrook Ct
- 1406 Briers Dr Unit 3
- 1051 Mariners Ct
- 1086 Old Saybrook Ct
- 4705 Mariners Way
- 4475 Watson Ridge Dr
- 4971 Demere Ct
- 4336 Morning View
- 4450 Richmond Ct
- 4457 Watson Ridge Dr
- 4738 Cedar Park Way Unit 4738
- 4738 Cedar Park Way
- 4744 Cedar Park Way
- 4734 Cedar Park Way
- 1438 Knights Trail
- 1442 Knights Trail
- 1440 Knights Trail
- 1444 Knights Trail
- 4746 Cedar Park Way
- 1446 Knights Trail
- 1446 Knights Trail Unit 26
- 1448 Knights Trail
- 1448 Knights Trail
- 4746 Cedar Park Way
- 4747 Cedar Park Way
- 4732 Cedar Park Way
- 1432 Knights Trail
- 4748 Cedar Park Way
- 1452 Knights Trail Unit 24
- 1452 Knights Trail Unit 1452