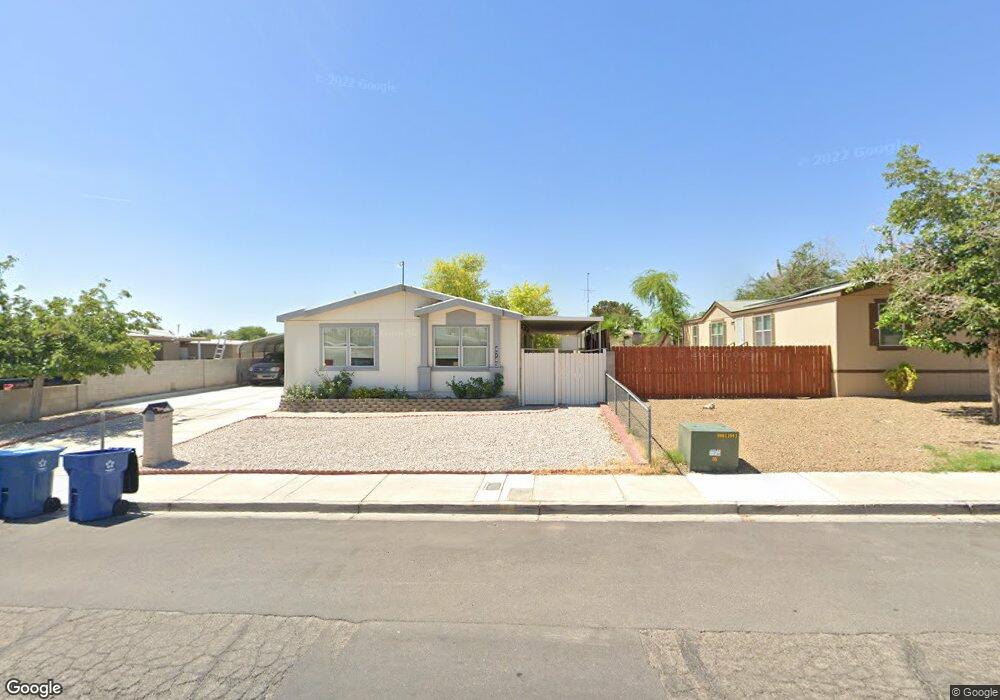
4743 Fiesta Way Las Vegas, NV 89121
Paradise Valley East NeighborhoodEstimated Value: $260,000 - $306,000
3
Beds
2
Baths
1,404
Sq Ft
$202/Sq Ft
Est. Value
About This Home
This home is located at 4743 Fiesta Way, Las Vegas, NV 89121 and is currently estimated at $283,101, approximately $201 per square foot. 4743 Fiesta Way is a home located in Clark County with nearby schools including Hal Smith Elementary School, Kathleen & Tim Harney Middle School, and Chaparral High School.
Ownership History
Date
Name
Owned For
Owner Type
Purchase Details
Closed on
Aug 14, 2015
Sold by
Swrtz Ross C and Swrtz Susan K
Bought by
Swartz Family Trust
Current Estimated Value
Purchase Details
Closed on
Jun 28, 2004
Sold by
Nationwide Homes Inc
Bought by
Swartz Ross C and Swartz Susan K
Home Financials for this Owner
Home Financials are based on the most recent Mortgage that was taken out on this home.
Original Mortgage
$150,999
Outstanding Balance
$75,683
Interest Rate
6.27%
Mortgage Type
VA
Estimated Equity
$207,418
Purchase Details
Closed on
Feb 6, 2004
Sold by
Pena Gloria
Bought by
Nationwide Homes Inc
Purchase Details
Closed on
Jan 27, 2004
Sold by
Huerta Tony and Huerta Frances M
Bought by
Pena Gloria
Purchase Details
Closed on
May 3, 2000
Sold by
Hasinfelt Ernest F
Bought by
Huerta Tony and Huerta Frances M
Create a Home Valuation Report for This Property
The Home Valuation Report is an in-depth analysis detailing your home's value as well as a comparison with similar homes in the area
Home Values in the Area
Average Home Value in this Area
Purchase History
| Date | Buyer | Sale Price | Title Company |
|---|---|---|---|
| Swartz Family Trust | -- | None Available | |
| Swartz Ross C | $151,000 | First American Title Co Of | |
| Nationwide Homes Inc | $50,000 | First American Title Co Of | |
| Pena Gloria | $50,000 | First American Title Co Of | |
| Huerta Tony | $45,000 | Old Republic Title Company |
Source: Public Records
Mortgage History
| Date | Status | Borrower | Loan Amount |
|---|---|---|---|
| Open | Swartz Ross C | $150,999 |
Source: Public Records
Tax History Compared to Growth
Tax History
| Year | Tax Paid | Tax Assessment Tax Assessment Total Assessment is a certain percentage of the fair market value that is determined by local assessors to be the total taxable value of land and additions on the property. | Land | Improvement |
|---|---|---|---|---|
| 2025 | $237 | $65,184 | $28,000 | $37,184 |
| 2024 | $231 | $65,184 | $28,000 | $37,184 |
| 2023 | $231 | $52,855 | $18,200 | $34,655 |
| 2022 | $248 | $49,743 | $18,200 | $31,543 |
| 2021 | $251 | $44,962 | $15,050 | $29,912 |
| 2020 | $234 | $41,524 | $11,900 | $29,624 |
| 2019 | $227 | $37,692 | $8,400 | $29,292 |
| 2018 | $223 | $35,225 | $7,000 | $28,225 |
| 2017 | $476 | $29,421 | $7,000 | $22,421 |
| 2016 | $206 | $26,460 | $6,300 | $20,160 |
| 2015 | $209 | $21,131 | $3,850 | $17,281 |
| 2014 | $568 | $24,883 | $5,250 | $19,633 |
Source: Public Records
Map
Nearby Homes
- 4794 Saguaro Way
- 3415 Encina Dr
- 4731 Fuentes Way
- 4505 E Desert Inn Rd Unit 46
- 4650 E Twain Ave
- 4938 Vista Flora Way
- 4954 Mar Vista Way
- 3462 Huerta Dr
- 3603 Huerta Dr
- 3685 Arbolado Dr Unit 4B
- 3127 Aloha Ave
- 3394 Allegheny Dr
- 3441 Cape Cod Dr
- 0 S Nellis Blvd
- 3470 Cape Cod Dr
- Summit Plan at Sunterra
- Spring Plan at Sunterra
- Willow Plan at Sunterra
- 4691 Woodland Ave
- 3033 Dagny St Unit lot 20
- 4755 Fiesta Way
- 4731 Fiesta Way
- 4750 Esplanade Way
- 4736 Esplanade Way
- 4722 Esplanade Way
- 4730 Fiesta Way
- 4778 Esplanade Way Unit 3
- 4766 Fiesta Way
- 4708 Esplanade Way
- 4794 Esplanade Way
- 4737 Esplanade Way Unit m/h
- 4737 Esplanade Way
- 4743 Hildago Way
- 4696 Esplanade Way
- 4755 Hildago Way
- 4731 Hildago Way
- 4731 Hildago Way Unit 3
- 4723 Esplanade Way
- 4719 Hildago Way
- 4694 Fiesta Way