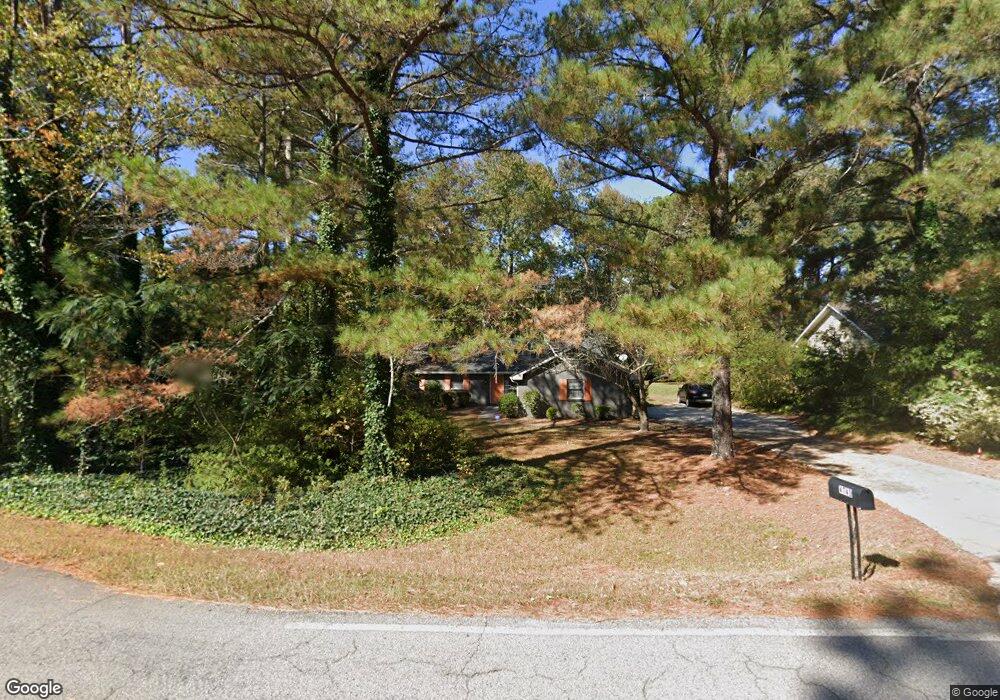
4743 Hull Rd SE Unit 3C Conyers, GA 30094
Estimated Value: $235,284 - $257,000
3
Beds
2
Baths
1,450
Sq Ft
$171/Sq Ft
Est. Value
About This Home
This home is located at 4743 Hull Rd SE Unit 3C, Conyers, GA 30094 and is currently estimated at $248,571, approximately $171 per square foot. 4743 Hull Rd SE Unit 3C is a home located in Rockdale County with nearby schools including Barksdale Elementary School, Gen. Ray Davis Middle School, and Salem High School.
Ownership History
Date
Name
Owned For
Owner Type
Purchase Details
Closed on
Jul 15, 2020
Sold by
Stivarius Properties Llc
Bought by
Dumas Tanzie
Current Estimated Value
Home Financials for this Owner
Home Financials are based on the most recent Mortgage that was taken out on this home.
Original Mortgage
$159,065
Outstanding Balance
$141,048
Interest Rate
3.1%
Mortgage Type
FHA
Estimated Equity
$107,523
Purchase Details
Closed on
Feb 10, 2016
Sold by
Stivarius Stephen M
Bought by
Stivarius Properties Llc
Purchase Details
Closed on
Apr 27, 2012
Sold by
Federal National Mortgage Association
Bought by
Stivarius Steve M and Stivarius Sherry P
Purchase Details
Closed on
Mar 6, 2012
Sold by
Green Tree Servicing Llc
Bought by
Federal National Mtg Associati
Purchase Details
Closed on
Nov 27, 1996
Sold by
Burtner Robert Kathleen
Bought by
Moore Janet
Create a Home Valuation Report for This Property
The Home Valuation Report is an in-depth analysis detailing your home's value as well as a comparison with similar homes in the area
Home Values in the Area
Average Home Value in this Area
Purchase History
| Date | Buyer | Sale Price | Title Company |
|---|---|---|---|
| Dumas Tanzie | $162,000 | -- | |
| Stivarius Properties Llc | -- | -- | |
| Stivarius Steve M | $48,100 | -- | |
| Federal National Mtg Associati | $96,072 | -- | |
| Green Tree Servicing Llc | $96,072 | -- | |
| Moore Janet | $92,500 | -- |
Source: Public Records
Mortgage History
| Date | Status | Borrower | Loan Amount |
|---|---|---|---|
| Open | Dumas Tanzie | $159,065 | |
| Closed | Moore Janet | $0 |
Source: Public Records
Tax History Compared to Growth
Tax History
| Year | Tax Paid | Tax Assessment Tax Assessment Total Assessment is a certain percentage of the fair market value that is determined by local assessors to be the total taxable value of land and additions on the property. | Land | Improvement |
|---|---|---|---|---|
| 2024 | $2,340 | $98,760 | $20,480 | $78,280 |
| 2023 | $2,086 | $91,800 | $20,480 | $71,320 |
| 2022 | $1,712 | $77,240 | $17,960 | $59,280 |
| 2021 | $1,391 | $61,480 | $11,040 | $50,440 |
| 2020 | $2,252 | $52,840 | $9,880 | $42,960 |
| 2019 | $1,900 | $42,320 | $8,400 | $33,920 |
| 2018 | $1,706 | $37,840 | $6,640 | $31,200 |
| 2017 | $1,566 | $34,400 | $7,240 | $27,160 |
| 2016 | $1,402 | $30,800 | $6,000 | $24,800 |
| 2015 | $1,360 | $29,840 | $5,200 | $24,640 |
| 2014 | $1,374 | $29,840 | $5,200 | $24,640 |
| 2013 | -- | $38,200 | $10,000 | $28,200 |
Source: Public Records
Map
Nearby Homes
- 385 Oglesby Bridge Rd SE
- 4797 Hemlock Dr SE
- 510 Bell Rd SE Unit 1
- 495 Oglesby Bridge Rd SE
- 570 Bell Rd SE
- 1023 Plantation Ct SE
- 550 Oglesby Bridge Rd SE
- 4811 W Lake Dr SE
- 246 Bridgewood Dr SE
- 1038 Plantation Blvd SE
- 4970 Hull Rd SE
- 4740 Shadybrook Way SE
- 4931 W Lake Dr SE
- 1119 Plantation Dr SE
- 4938 Lake Forest Dr SE
- 604 Hamlet Ct SE
- 1459 Highway 212 SW
- 4731 Shadybrook Way SE Unit 2
- 1061 Plantation Blvd SE
- 4743 Hull Rd SE Unit 1
- 4743 Hull Rd SE
- 4733 Hull Rd SE
- 390 Bridgewood Dr SE
- 4730 Kensington Ct SE
- 4723 Hull Rd SE
- 380 Bridgewood Dr SE Unit 2
- 4720 Kensington Ct SE
- 391 Bridgewood Dr SE
- 4728 Hull Rd SE
- 381 Bridgewood Dr SE
- 4731 Kensington Ct SE Unit 2
- 4766 Hull Rd SE
- 429 Bell Rd SE
- 4773 Hull Rd SE Unit 2
- 4671 Hull Rd SE
- 4751 Kensington Ct SE
- 439 Bell Rd SE
- 0 Hull Rd SE Unit 8689386
- 0 Hull Rd SE Unit 8583797