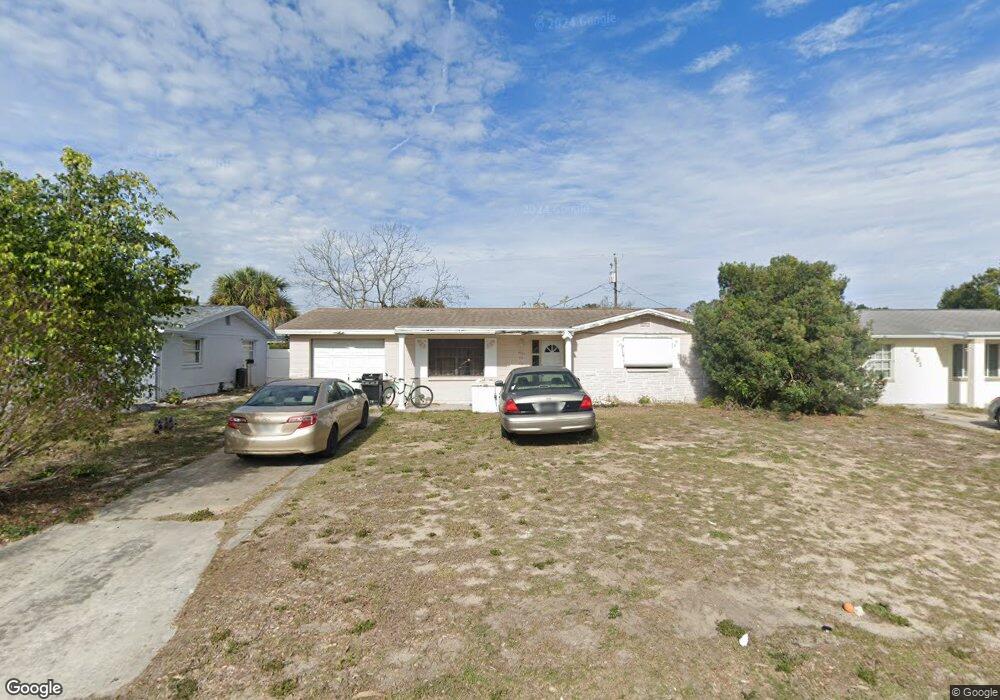
4743 Trafford Rd Holiday, FL 34690
Estimated Value: $156,000 - $204,000
2
Beds
1
Bath
988
Sq Ft
$186/Sq Ft
Est. Value
About This Home
This home is located at 4743 Trafford Rd, Holiday, FL 34690 and is currently estimated at $183,515, approximately $185 per square foot. 4743 Trafford Rd is a home located in Pasco County with nearby schools including Sunray Elementary School, Paul R. Smith Middle School, and Anclote High School.
Ownership History
Date
Name
Owned For
Owner Type
Purchase Details
Closed on
Feb 17, 2021
Sold by
Miele Lorraine Miele
Bought by
Myers John W and Myers Jennifer A
Current Estimated Value
Home Financials for this Owner
Home Financials are based on the most recent Mortgage that was taken out on this home.
Original Mortgage
$114,000
Interest Rate
2.7%
Mortgage Type
Seller Take Back
Purchase Details
Closed on
Feb 10, 2005
Sold by
Miele Joseph and Miele Lorraine S
Bought by
Miele Lorraine
Purchase Details
Closed on
Jun 16, 2004
Sold by
Betit Randall E and Betit Frances
Bought by
Miele Joseph and Miele Lorraine
Home Financials for this Owner
Home Financials are based on the most recent Mortgage that was taken out on this home.
Original Mortgage
$48,800
Interest Rate
6.25%
Mortgage Type
Purchase Money Mortgage
Create a Home Valuation Report for This Property
The Home Valuation Report is an in-depth analysis detailing your home's value as well as a comparison with similar homes in the area
Home Values in the Area
Average Home Value in this Area
Purchase History
| Date | Buyer | Sale Price | Title Company |
|---|---|---|---|
| Myers John W | $120,000 | Anclote Title Services Inc | |
| Miele Lorraine | -- | -- | |
| Miele Joseph | $61,000 | Anclote Title Services Inc | |
| Betit Randall E | $32,000 | Anclote Title Services Inc |
Source: Public Records
Mortgage History
| Date | Status | Borrower | Loan Amount |
|---|---|---|---|
| Closed | Myers John W | $114,000 | |
| Previous Owner | Miele Joseph | $48,800 |
Source: Public Records
Tax History
| Year | Tax Paid | Tax Assessment Tax Assessment Total Assessment is a certain percentage of the fair market value that is determined by local assessors to be the total taxable value of land and additions on the property. | Land | Improvement |
|---|---|---|---|---|
| 2026 | $2,160 | $150,802 | $37,239 | $113,563 |
| 2025 | $2,160 | $150,802 | $37,239 | $113,563 |
| 2024 | $2,160 | $154,850 | -- | -- |
| 2023 | $2,072 | $150,345 | $30,639 | $119,706 |
| 2022 | $2,030 | $115,967 | $25,539 | $90,428 |
| 2021 | $1,305 | $92,516 | $20,435 | $72,081 |
| 2020 | $1,332 | $69,456 | $10,521 | $58,935 |
| 2019 | $1,220 | $58,468 | $10,521 | $47,947 |
| 2018 | $935 | $51,848 | $10,521 | $41,327 |
| 2017 | $823 | $38,026 | $8,721 | $29,305 |
| 2016 | $780 | $37,365 | $8,721 | $28,644 |
| 2015 | $774 | $36,237 | $8,721 | $27,516 |
| 2014 | $726 | $35,366 | $8,721 | $26,645 |
Source: Public Records
Map
Nearby Homes
- 4815 Trafford Rd
- 4750 Foothill Dr
- 4834 Darlington Rd
- 4626 Abdella Ln
- 2605 Limewood Dr
- 4614 Taray Ln
- 4550 Abdella Ln
- 2406 Arcadia Rd
- 4627 Tropical Ln
- 4723 Aegean Ave
- 4823 Aegean Ave
- 2453 Santiago Dr
- 2577 Charlan Ct
- 2578 Charlan Ct
- 2627 Charlan Ct
- 2327 Lemur Dr
- 5131 Forum Blvd
- 5124 Darlington Rd
- 2400 Lemur Dr
- 4360 Tahitian Gardens Cir Unit H
- 4751 Trafford Rd
- 4735 Trafford Rd
- 4742 Blossom Dr
- 4736 Blossom Dr
- 4750 Blossom Dr
- 4803 Trafford Rd
- 4742 Trafford Rd
- 4730 Blossom Dr
- 4802 Blossom Dr
- 4736 Trafford Rd
- 4750 Trafford Rd
- 4725 Trafford Rd
- 4809 Trafford Rd
- 4730 Trafford Rd
- 4802 Trafford Rd
- 4724 Blossom Dr
- 4808 Blossom Dr
- 4724 Trafford Rd
- 4808 Trafford Rd
- 4719 Trafford Rd
Your Personal Tour Guide
Ask me questions while you tour the home.