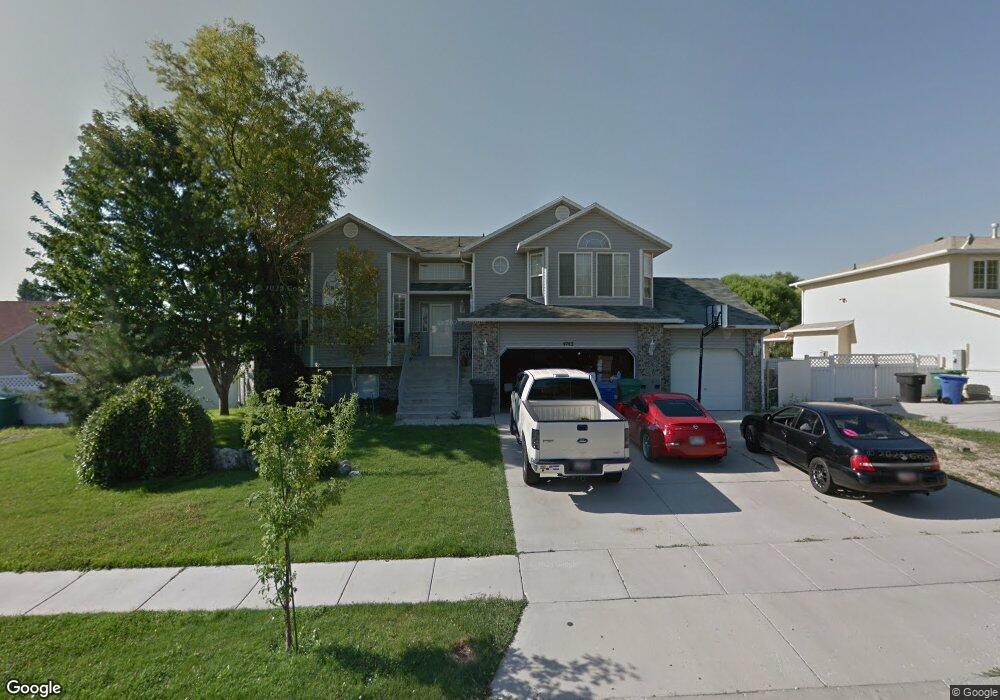
4743 W 8230 S West Jordan, UT 84088
Jordan Oaks NeighborhoodEstimated Value: $617,000 - $653,000
4
Beds
3
Baths
1,902
Sq Ft
$336/Sq Ft
Est. Value
About This Home
This home is located at 4743 W 8230 S, West Jordan, UT 84088 and is currently estimated at $639,961, approximately $336 per square foot. 4743 W 8230 S is a home located in Salt Lake County with nearby schools including Jordan Hills Elementary School, West Hills Middle School, and Copper Hills High School.
Ownership History
Date
Name
Owned For
Owner Type
Purchase Details
Closed on
Feb 23, 2022
Sold by
Denison Jeffery K
Bought by
Denison Jeffery K
Current Estimated Value
Purchase Details
Closed on
Jan 31, 2022
Sold by
Denison Jeffery K
Bought by
Denison Jeffery K
Purchase Details
Closed on
Jan 18, 2007
Sold by
Denison Jeff K and Denison Michelle L
Bought by
Denison Jeffery K and Denison Michelle L
Home Financials for this Owner
Home Financials are based on the most recent Mortgage that was taken out on this home.
Original Mortgage
$290,000
Interest Rate
6.1%
Mortgage Type
New Conventional
Purchase Details
Closed on
Jul 13, 1999
Sold by
Woodside Homes Corp
Bought by
Denison Jeff K and Denison Michelle L
Home Financials for this Owner
Home Financials are based on the most recent Mortgage that was taken out on this home.
Original Mortgage
$181,500
Interest Rate
7.4%
Create a Home Valuation Report for This Property
The Home Valuation Report is an in-depth analysis detailing your home's value as well as a comparison with similar homes in the area
Home Values in the Area
Average Home Value in this Area
Purchase History
| Date | Buyer | Sale Price | Title Company |
|---|---|---|---|
| Denison Jeffery K | -- | None Listed On Document | |
| Denison Jeffery K | -- | None Listed On Document | |
| Denison Jeffery K | -- | Backman Title Services | |
| Denison Jeff K | -- | First American Title |
Source: Public Records
Mortgage History
| Date | Status | Borrower | Loan Amount |
|---|---|---|---|
| Previous Owner | Denison Jeffery K | $290,000 | |
| Previous Owner | Denison Jeff K | $181,500 |
Source: Public Records
Tax History Compared to Growth
Tax History
| Year | Tax Paid | Tax Assessment Tax Assessment Total Assessment is a certain percentage of the fair market value that is determined by local assessors to be the total taxable value of land and additions on the property. | Land | Improvement |
|---|---|---|---|---|
| 2025 | $3,147 | $613,200 | $169,300 | $443,900 |
| 2024 | $3,147 | $605,500 | $167,600 | $437,900 |
| 2023 | $3,147 | $576,600 | $158,100 | $418,500 |
| 2022 | $3,191 | $569,300 | $155,000 | $414,300 |
| 2021 | $2,704 | $439,100 | $120,500 | $318,600 |
| 2020 | $2,526 | $385,000 | $120,500 | $264,500 |
| 2019 | $2,507 | $374,700 | $113,700 | $261,000 |
| 2018 | $2,377 | $352,400 | $113,700 | $238,700 |
| 2017 | $2,247 | $331,600 | $113,700 | $217,900 |
| 2016 | $2,185 | $303,000 | $113,700 | $189,300 |
| 2015 | $2,175 | $294,000 | $120,200 | $173,800 |
| 2014 | $2,007 | $267,200 | $110,500 | $156,700 |
Source: Public Records
Map
Nearby Homes
- 7903 Mckenzie Ln
- 7886 Mckenzie Ln
- 8359 Etude Dr
- 4678 Emmons Dr
- 7973 S Nebo Dr
- 8322 Copper Vista Cir
- 4887 W 8620 S
- 8577 Autumn Gold Cir
- 5183 W Swift Water Way
- 7908 Cold Stone Ln Unit N3
- 5189 W Dove Creek Ln
- 8441 S Spratling Dr
- 5228 W Ranches Loop Rd
- 7882 S Dove Creek Ln Unit A6
- 5298 W Icehouse Way
- 8453 S Windmill Dr
- 4624 Pine Crossing Dr
- 5422 W Island Creek Dr
- 7518 Park Village Dr
- 7502 S Lace Wood Dr Unit 417