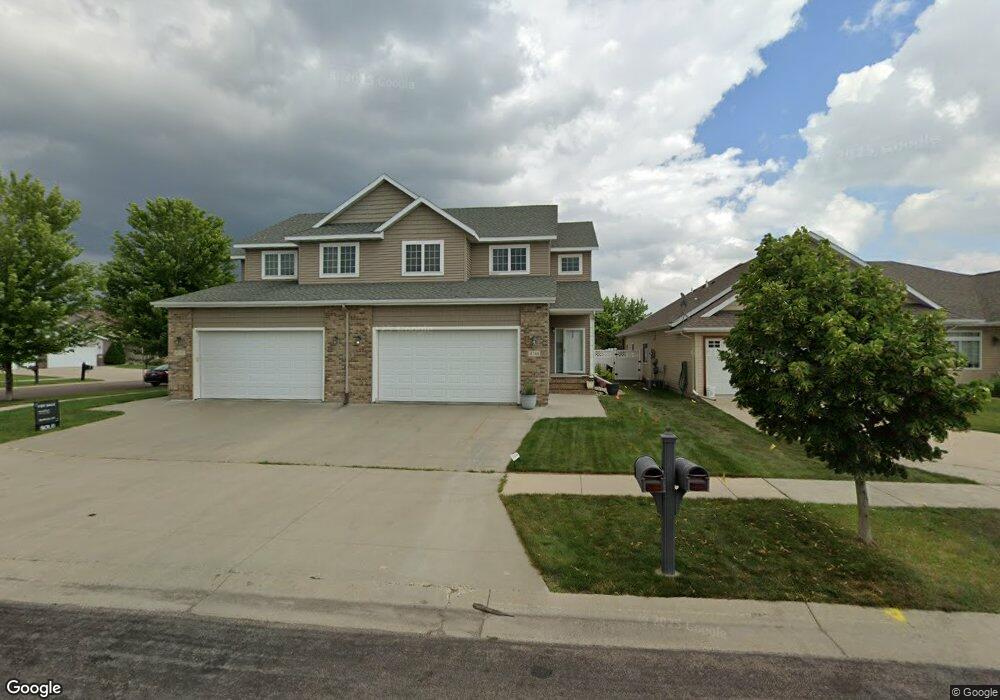
4744 Clock Tower Ln S Fargo, ND 58104
Osgood NeighborhoodEstimated Value: $290,668 - $321,000
2
Beds
3
Baths
2,347
Sq Ft
$129/Sq Ft
Est. Value
About This Home
This home is located at 4744 Clock Tower Ln S, Fargo, ND 58104 and is currently estimated at $302,667, approximately $128 per square foot. 4744 Clock Tower Ln S is a home located in Cass County with nearby schools including Osgood Elementary School, Liberty Middle School, and West Fargo Sheyenne High School.
Ownership History
Date
Name
Owned For
Owner Type
Purchase Details
Closed on
May 4, 2021
Sold by
Tupa Peter A
Bought by
Solseth Kimberly A
Current Estimated Value
Home Financials for this Owner
Home Financials are based on the most recent Mortgage that was taken out on this home.
Original Mortgage
$229,425
Outstanding Balance
$207,916
Interest Rate
3.1%
Mortgage Type
New Conventional
Estimated Equity
$94,751
Purchase Details
Closed on
Dec 4, 2018
Sold by
Regan Jeanine A O
Bought by
Tupa Peter A
Home Financials for this Owner
Home Financials are based on the most recent Mortgage that was taken out on this home.
Original Mortgage
$198,000
Interest Rate
4.8%
Mortgage Type
New Conventional
Purchase Details
Closed on
Oct 31, 2006
Sold by
Estoria Corp
Bought by
Miller Jared and Miller Andrea
Home Financials for this Owner
Home Financials are based on the most recent Mortgage that was taken out on this home.
Original Mortgage
$138,500
Interest Rate
7%
Mortgage Type
FHA
Create a Home Valuation Report for This Property
The Home Valuation Report is an in-depth analysis detailing your home's value as well as a comparison with similar homes in the area
Home Values in the Area
Average Home Value in this Area
Purchase History
| Date | Buyer | Sale Price | Title Company |
|---|---|---|---|
| Solseth Kimberly A | $241,500 | Title Company Residential | |
| Tupa Peter A | $220,000 | None Available | |
| Miller Jared | -- | -- |
Source: Public Records
Mortgage History
| Date | Status | Borrower | Loan Amount |
|---|---|---|---|
| Open | Solseth Kimberly A | $229,425 | |
| Previous Owner | Tupa Peter A | $198,000 | |
| Previous Owner | Miller Jared | $138,500 |
Source: Public Records
Tax History Compared to Growth
Tax History
| Year | Tax Paid | Tax Assessment Tax Assessment Total Assessment is a certain percentage of the fair market value that is determined by local assessors to be the total taxable value of land and additions on the property. | Land | Improvement |
|---|---|---|---|---|
| 2024 | $3,442 | $113,450 | $20,100 | $93,350 |
| 2023 | $3,352 | $110,850 | $17,900 | $92,950 |
| 2022 | $3,470 | $110,850 | $17,900 | $92,950 |
| 2021 | $3,497 | $110,850 | $17,900 | $92,950 |
| 2020 | $3,260 | $103,600 | $17,900 | $85,700 |
| 2019 | $3,274 | $103,600 | $9,950 | $93,650 |
| 2018 | $3,172 | $103,600 | $9,950 | $93,650 |
| 2017 | $2,972 | $97,950 | $9,950 | $88,000 |
| 2016 | $2,625 | $89,050 | $9,950 | $79,100 |
| 2015 | $2,725 | $89,050 | $7,450 | $81,600 |
| 2014 | $2,945 | $94,800 | $7,450 | $87,350 |
| 2013 | $2,954 | $92,050 | $7,450 | $84,600 |
Source: Public Records
Map
Nearby Homes
- 4723 Clock Tower Ln S
- 4775 Townsite Place S
- 4758 Townsite Place S
- 4450 48th St S
- 4281 Estate Dr S
- 4272 51st St S
- 4110 52nd St S
- 4127 52nd St S
- 3712 49th St S
- 4245 Coventry Dr S
- 4394 46th Ave S Unit B
- 4318 39 1 2 Ave S
- 4824 Decorah Way S
- 5466 Justice Dr S
- 3630 Decorah Way S
- 1665 3-Stall Plan at The Residence at Valley View Estates
- 4306 39th Ave S
- 4849 Decorah Way S
- 3624 Decorah Way
- 4801 Decorah Way S
- 4750 Clock Tower Ln S
- 4752 Clock Tower Ln S
- 4758 Clock Tower Ln S
- 4760 Clock Tower Ln S
- 4749 Clock Tower Ln S
- 4753 Clock Tower Ln S
- 4755 Clock Tower Ln S
- 4747 Clock Tower Ln S
- 4741 Clock Tower Ln S
- 4766 Clock Tower Ln S
- 4761 Clock Tower Ln S
- 4729 Clock Tower Ln S
- 4325 47th St S
- 4731 Clock Tower Ln S
- 4309 47th St S
- 4327 47th St S
- 4739 Clock Tower Ln S
- 4763 Clock Tower Ln S
- 4721 Clock Tower Ln S
- 4341 47th St S