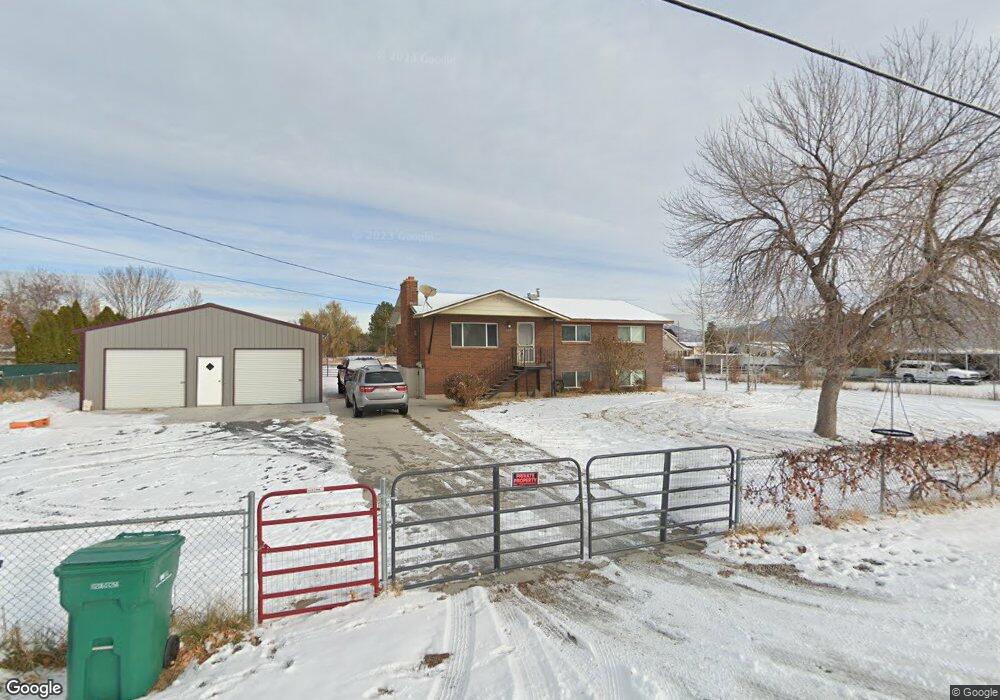
4744 W 5100 S Hooper, UT 84315
Estimated Value: $538,000 - $594,000
5
Beds
2
Baths
2,400
Sq Ft
$232/Sq Ft
Est. Value
About This Home
This home is located at 4744 W 5100 S, Hooper, UT 84315 and is currently estimated at $557,731, approximately $232 per square foot. 4744 W 5100 S is a home located in Weber County with nearby schools including Country View School, Rocky Mountain Junior High School, and Quest Academy.
Ownership History
Date
Name
Owned For
Owner Type
Purchase Details
Closed on
Dec 9, 2020
Sold by
Weaver Michael T
Bought by
Betker Anthony and Betker Catherine
Current Estimated Value
Home Financials for this Owner
Home Financials are based on the most recent Mortgage that was taken out on this home.
Original Mortgage
$316,800
Outstanding Balance
$282,046
Interest Rate
2.7%
Mortgage Type
New Conventional
Estimated Equity
$275,685
Purchase Details
Closed on
Jun 20, 2017
Sold by
Clark Michael F and Clark Mitcelle
Bought by
Waver Michaerl T
Home Financials for this Owner
Home Financials are based on the most recent Mortgage that was taken out on this home.
Original Mortgage
$266,000
Interest Rate
3.95%
Mortgage Type
New Conventional
Purchase Details
Closed on
Sep 13, 2010
Sold by
Wayment Mark
Bought by
Clarke Michael F and Clarke Michelle J
Home Financials for this Owner
Home Financials are based on the most recent Mortgage that was taken out on this home.
Original Mortgage
$167,025
Interest Rate
3.75%
Mortgage Type
FHA
Purchase Details
Closed on
May 12, 2009
Sold by
Morris Mark C and Morris Bridgett Lee
Bought by
Wayment Mark
Purchase Details
Closed on
Sep 13, 2007
Sold by
M & S Rental Management Llc
Bought by
Morris Mark C and Morris Bridgett Lee
Home Financials for this Owner
Home Financials are based on the most recent Mortgage that was taken out on this home.
Original Mortgage
$215,000
Interest Rate
6.67%
Mortgage Type
Seller Take Back
Purchase Details
Closed on
Nov 16, 2006
Sold by
Wayment Mark E and Wayment Shauna
Bought by
M & S Rental Management Llc
Home Financials for this Owner
Home Financials are based on the most recent Mortgage that was taken out on this home.
Original Mortgage
$135,000
Interest Rate
6.36%
Mortgage Type
Credit Line Revolving
Purchase Details
Closed on
Apr 28, 2006
Sold by
Wheeler Anne Leilani
Bought by
M & S Rentals Llc
Purchase Details
Closed on
Sep 8, 2003
Sold by
Wheeler Anne Leilani
Bought by
Wheeler Anne Leilani
Purchase Details
Closed on
Oct 26, 2001
Sold by
Wheeler F Lee and Wheeler Anne
Bought by
Wheeler F Lee
Home Financials for this Owner
Home Financials are based on the most recent Mortgage that was taken out on this home.
Original Mortgage
$72,406
Interest Rate
6.84%
Mortgage Type
Credit Line Revolving
Create a Home Valuation Report for This Property
The Home Valuation Report is an in-depth analysis detailing your home's value as well as a comparison with similar homes in the area
Home Values in the Area
Average Home Value in this Area
Purchase History
| Date | Buyer | Sale Price | Title Company |
|---|---|---|---|
| Betker Anthony | -- | Inwest Title Services Inc | |
| Waver Michaerl T | -- | Old Republic Title | |
| Clarke Michael F | -- | Bonneville Superior Title Co | |
| Wayment Mark | -- | None Available | |
| Morris Mark C | -- | Bonneville Superior Title Co | |
| M & S Rental Management Llc | -- | Accommodation | |
| Wayment Mark E | -- | Bonneville Superior Title Co | |
| M & S Rentals Llc | -- | Equity Title | |
| Wheeler Anne Leilani | -- | -- | |
| Wheeler F Lee | -- | Inwest Title Services Inc | |
| Wheeler F Lee | -- | Inwest Title Services Inc |
Source: Public Records
Mortgage History
| Date | Status | Borrower | Loan Amount |
|---|---|---|---|
| Open | Betker Anthony | $316,800 | |
| Previous Owner | Waver Michaerl T | $266,000 | |
| Previous Owner | Clarke Michael F | $167,025 | |
| Previous Owner | Morris Mark C | $215,000 | |
| Previous Owner | Wayment Mark E | $135,000 | |
| Previous Owner | Wheeler F Lee | $72,406 |
Source: Public Records
Tax History Compared to Growth
Tax History
| Year | Tax Paid | Tax Assessment Tax Assessment Total Assessment is a certain percentage of the fair market value that is determined by local assessors to be the total taxable value of land and additions on the property. | Land | Improvement |
|---|---|---|---|---|
| 2025 | $2,625 | $448,827 | $179,965 | $268,862 |
| 2024 | $2,525 | $246,568 | $98,980 | $147,588 |
| 2023 | $2,541 | $245,961 | $123,748 | $122,213 |
| 2022 | $2,773 | $268,951 | $99,002 | $169,949 |
| 2021 | $2,253 | $366,000 | $110,068 | $255,932 |
| 2020 | $2,207 | $327,001 | $90,008 | $236,993 |
| 2019 | $2,101 | $295,001 | $63,000 | $232,001 |
| 2018 | $1,931 | $260,001 | $63,000 | $197,001 |
| 2017 | $1,671 | $217,001 | $63,000 | $154,001 |
| 2016 | $1,474 | $106,525 | $24,798 | $81,727 |
| 2015 | $1,441 | $102,633 | $24,798 | $77,835 |
| 2014 | $1,406 | $97,426 | $29,150 | $68,276 |
Source: Public Records
Map
Nearby Homes