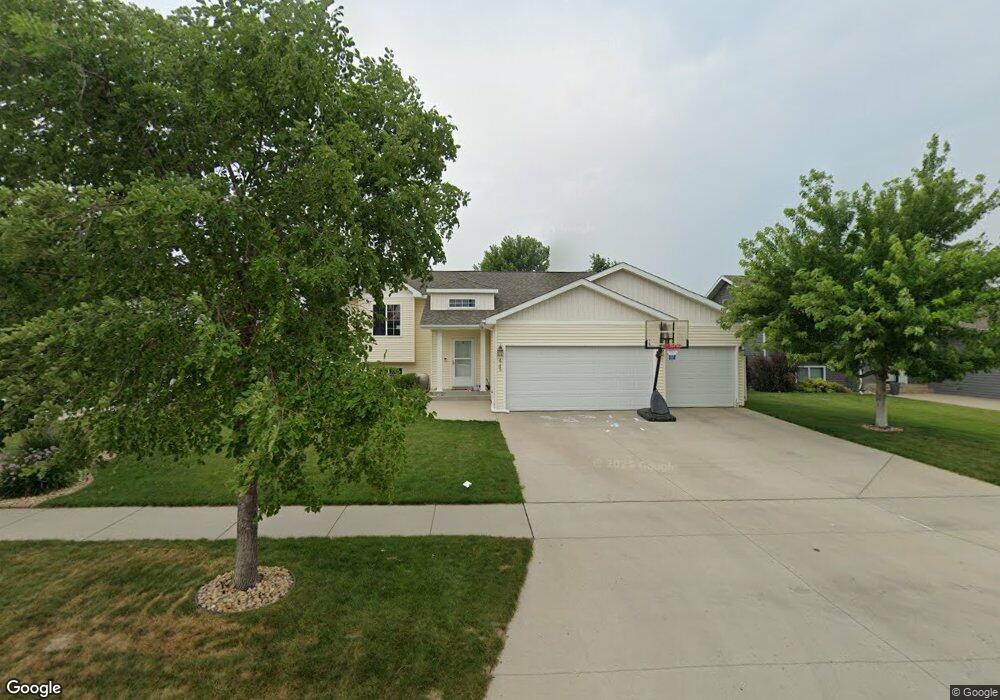
4745 51st St S Fargo, ND 58104
Osgood NeighborhoodEstimated Value: $329,000 - $366,547
4
Beds
2
Baths
2,230
Sq Ft
$154/Sq Ft
Est. Value
About This Home
This home is located at 4745 51st St S, Fargo, ND 58104 and is currently estimated at $343,637, approximately $154 per square foot. 4745 51st St S is a home located in Cass County with nearby schools including Osgood Elementary School, Liberty Middle School, and West Fargo Sheyenne High School.
Ownership History
Date
Name
Owned For
Owner Type
Purchase Details
Closed on
Feb 15, 2013
Sold by
Hiam Timothy M and Hiam Cindy M
Bought by
Braaten Tyler and Braaten Ashley
Current Estimated Value
Home Financials for this Owner
Home Financials are based on the most recent Mortgage that was taken out on this home.
Original Mortgage
$179,141
Outstanding Balance
$124,823
Interest Rate
3.34%
Mortgage Type
New Conventional
Estimated Equity
$218,814
Purchase Details
Closed on
Oct 22, 2008
Sold by
Family Built & Decks Inc
Bought by
Scufsa Rudolph J and Scufsa Susan M
Purchase Details
Closed on
Nov 30, 2007
Sold by
Jordahl Custom Homes Inc
Bought by
Hiam Timothy M
Home Financials for this Owner
Home Financials are based on the most recent Mortgage that was taken out on this home.
Original Mortgage
$145,200
Interest Rate
6.47%
Mortgage Type
New Conventional
Create a Home Valuation Report for This Property
The Home Valuation Report is an in-depth analysis detailing your home's value as well as a comparison with similar homes in the area
Home Values in the Area
Average Home Value in this Area
Purchase History
| Date | Buyer | Sale Price | Title Company |
|---|---|---|---|
| Braaten Tyler | $185,000 | None Available | |
| Scufsa Rudolph J | -- | -- | |
| Hiam Timothy M | -- | -- | |
| Jordahl Custom Homes Inc | -- | -- |
Source: Public Records
Mortgage History
| Date | Status | Borrower | Loan Amount |
|---|---|---|---|
| Open | Braaten Tyler | $179,141 | |
| Previous Owner | Hiam Timothy M | $145,200 |
Source: Public Records
Tax History Compared to Growth
Tax History
| Year | Tax Paid | Tax Assessment Tax Assessment Total Assessment is a certain percentage of the fair market value that is determined by local assessors to be the total taxable value of land and additions on the property. | Land | Improvement |
|---|---|---|---|---|
| 2024 | $5,305 | $168,300 | $31,450 | $136,850 |
| 2023 | $5,794 | $168,300 | $32,300 | $136,000 |
| 2022 | $5,667 | $157,300 | $32,300 | $125,000 |
| 2021 | $5,256 | $139,800 | $32,300 | $107,500 |
| 2020 | $5,086 | $135,750 | $32,300 | $103,450 |
| 2019 | $4,941 | $135,750 | $20,200 | $115,550 |
| 2018 | $4,842 | $135,750 | $20,200 | $115,550 |
| 2017 | $4,489 | $124,400 | $20,200 | $104,200 |
| 2016 | $4,289 | $113,100 | $20,200 | $92,900 |
| 2015 | $4,380 | $113,100 | $13,750 | $99,350 |
| 2014 | $4,026 | $93,950 | $13,750 | $80,200 |
| 2013 | $3,780 | $87,800 | $13,750 | $74,050 |
Source: Public Records
Map
Nearby Homes