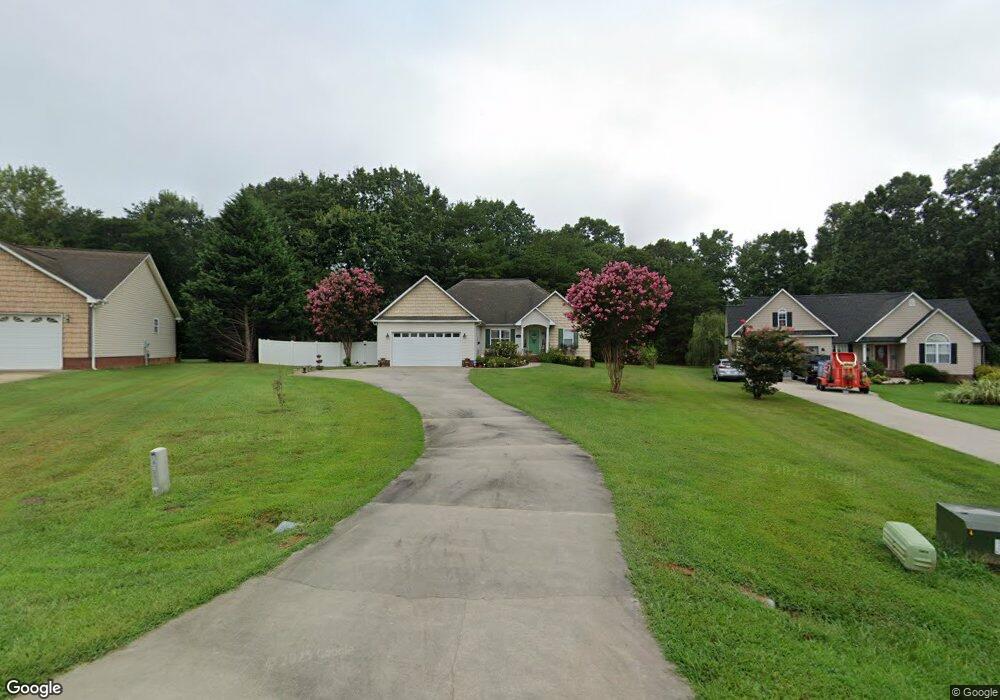
4745 Across Field Ct Maiden, NC 28650
Estimated Value: $351,000 - $365,000
3
Beds
2
Baths
1,582
Sq Ft
$225/Sq Ft
Est. Value
About This Home
This home is located at 4745 Across Field Ct, Maiden, NC 28650 and is currently estimated at $356,351, approximately $225 per square foot. 4745 Across Field Ct is a home located in Lincoln County with nearby schools including Pumpkin Center Primary, Pumpkin Center Intermediate, and North Lincoln Middle School.
Ownership History
Date
Name
Owned For
Owner Type
Purchase Details
Closed on
Nov 26, 2014
Sold by
Skiba Amber and Skiba David
Bought by
Flanigan Valerie A
Current Estimated Value
Purchase Details
Closed on
Dec 28, 2006
Sold by
Motz Troy A
Bought by
Skiba Amber S
Home Financials for this Owner
Home Financials are based on the most recent Mortgage that was taken out on this home.
Original Mortgage
$84,500
Interest Rate
6.19%
Mortgage Type
New Conventional
Purchase Details
Closed on
Jun 21, 2006
Sold by
Mccurry Kenneth M and Mccurry Kathrine B
Bought by
Motz Troy A
Home Financials for this Owner
Home Financials are based on the most recent Mortgage that was taken out on this home.
Original Mortgage
$110,000
Interest Rate
6.49%
Mortgage Type
FHA
Purchase Details
Closed on
Oct 7, 2005
Sold by
Mccurry Kenneth M and Mccurry Katherine B
Bought by
Mccurry Kenneth M
Create a Home Valuation Report for This Property
The Home Valuation Report is an in-depth analysis detailing your home's value as well as a comparison with similar homes in the area
Home Values in the Area
Average Home Value in this Area
Purchase History
| Date | Buyer | Sale Price | Title Company |
|---|---|---|---|
| Flanigan Valerie A | $160,000 | None Available | |
| Skiba Amber S | $165,000 | None Available | |
| Motz Troy A | $16,000 | None Available | |
| Mccurry Kenneth M | $16,000 | None Available |
Source: Public Records
Mortgage History
| Date | Status | Borrower | Loan Amount |
|---|---|---|---|
| Previous Owner | Skiba Amber S | $84,500 | |
| Previous Owner | Motz Troy A | $110,000 |
Source: Public Records
Tax History Compared to Growth
Tax History
| Year | Tax Paid | Tax Assessment Tax Assessment Total Assessment is a certain percentage of the fair market value that is determined by local assessors to be the total taxable value of land and additions on the property. | Land | Improvement |
|---|---|---|---|---|
| 2025 | $2,148 | $327,004 | $35,000 | $292,004 |
| 2024 | $2,102 | $327,004 | $35,000 | $292,004 |
| 2023 | $2,090 | $327,004 | $35,000 | $292,004 |
| 2022 | $1,432 | $178,223 | $28,000 | $150,223 |
| 2021 | $1,432 | $178,223 | $28,000 | $150,223 |
| 2020 | $1,281 | $178,223 | $28,000 | $150,223 |
| 2019 | $1,240 | $178,223 | $28,000 | $150,223 |
| 2018 | $1,301 | $169,444 | $26,000 | $143,444 |
| 2017 | $1,200 | $169,444 | $26,000 | $143,444 |
| 2016 | $1,200 | $169,444 | $26,000 | $143,444 |
| 2015 | $1,262 | $169,444 | $26,000 | $143,444 |
| 2014 | $1,172 | $157,123 | $26,000 | $131,123 |
Source: Public Records
Map
Nearby Homes
- 4805 Mountain View Ln
- 4553 Brave Ave
- 6238 S Nc 16 Business Hwy
- 2656 Lee Lawing Rd
- 2616 Lee Lawing Rd
- 2557 Beth Haven Church Rd
- 6075 Willow Farm Dr
- 2586 Lee Lawing Rd
- 5508 Wrenn Dr
- 5536 & 5538 Wrenn Dr
- 0 S Nc Hwy 16 Business Hwy
- 4453 Brancer Ln Unit 4
- 4931 King Wilkinson Rd
- 4442 Brancer Ln Unit 17
- 5790 Mundy Rd
- 4436 Brancer Ln Unit 16
- 5858 Mundy Rd
- 5605 Wrenn Dr
- 57+/- Acres Grassy Creek Rd
- 5780 N Carolina 16 Business
- 4743 Across Field Ct
- 4747 Across Field Ct
- 4718 Mountain View Ln
- 4749 Across Field Ct
- 4731 Across Field Ct
- 4750 Across Field Ct
- 4750 Across Field Ct Unit 28
- 4738 Mountain View Ln
- 4698 Mountain View Ln
- 4761 Across Field Ct
- 4730 Across Field Ct Unit 29
- 4730 Across Field Ct
- 4768 Across Field Ct
- 4719 Across Field Ct
- 4772 Mountain View Ln
- 4723 Mountain View Ln
- 4798 Mountain View Ln
- 4771 Across Field Ct
- 4695 Mountain View Ln
- 4674 Mountain View Ln