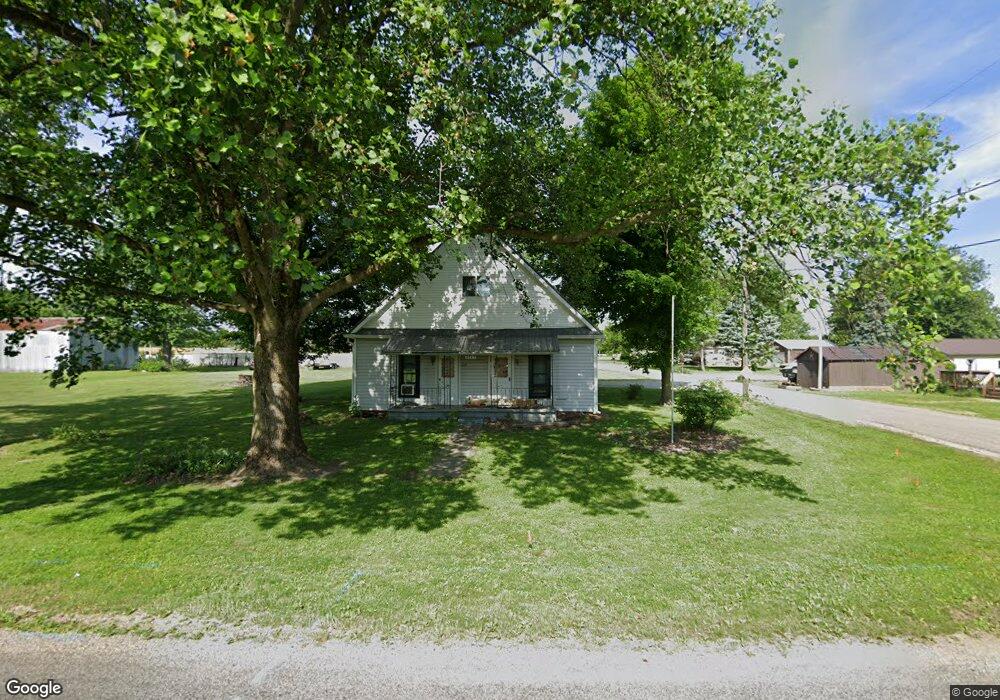
4745 N Main St Cayuga, IN 47928
Estimated Value: $95,000 - $114,375
Studio
1
Bath
1,024
Sq Ft
$101/Sq Ft
Est. Value
About This Home
This home is located at 4745 N Main St, Cayuga, IN 47928 and is currently estimated at $103,844, approximately $101 per square foot. 4745 N Main St is a home located in Vermillion County with nearby schools including North Vermillion Elementary School, North Vermillion High School, and RESCARE RESIDENTIAL PROGRAM.
Ownership History
Date
Name
Owned For
Owner Type
Purchase Details
Closed on
Nov 3, 2017
Sold by
Kilpatrick Roberta
Bought by
Hawk Colonel Alex
Current Estimated Value
Purchase Details
Closed on
Aug 6, 2013
Sold by
Whittington Bill D and Shaw Rebecca A
Bought by
Hawk Colonel Alex
Purchase Details
Closed on
Mar 2, 2009
Sold by
Melton Luther
Bought by
Switzer Minnie
Create a Home Valuation Report for This Property
The Home Valuation Report is an in-depth analysis detailing your home's value as well as a comparison with similar homes in the area
Purchase History
| Date | Buyer | Sale Price | Title Company |
|---|---|---|---|
| Hawk Colonel Alex | -- | -- | |
| Hawk Colonel Alex | $35,000 | -- | |
| Alex Colonel | $35,000 | Wallace Law Firm | |
| Switzer Minnie | -- | Aukerman Law Firm | |
| Switzer Minnie | $49,000 | -- | |
| Minnie Switzer | $49,000 | Aukerman Law Firm | |
| Switzer Minnie | $49,000 | -- |
Source: Public Records
Tax History
| Year | Tax Paid | Tax Assessment Tax Assessment Total Assessment is a certain percentage of the fair market value that is determined by local assessors to be the total taxable value of land and additions on the property. | Land | Improvement |
|---|---|---|---|---|
| 2025 | $339 | $93,100 | $8,300 | $84,800 |
| 2024 | $339 | $76,100 | $8,300 | $67,800 |
| 2023 | $416 | $67,400 | $8,300 | $59,100 |
| 2022 | $380 | $65,200 | $5,500 | $59,700 |
| 2021 | $300 | $56,400 | $4,500 | $51,900 |
| 2020 | $323 | $61,600 | $8,000 | $53,600 |
| 2019 | $298 | $57,400 | $8,000 | $49,400 |
| 2018 | $294 | $57,800 | $8,000 | $49,800 |
| 2017 | $261 | $53,300 | $8,000 | $45,300 |
| 2016 | $294 | $52,000 | $8,000 | $44,000 |
| 2014 | $269 | $53,000 | $8,000 | $45,000 |
| 2013 | $269 | $53,000 | $8,000 | $45,000 |
Source: Public Records
Map
Nearby Homes
- 404 S 8th St
- 610 Arrasmith Ave
- 219 N Wabash St
- 0 State Road 234
- 0 N 100 St W Unit 108460
- Fox Tail Ln
- 9015 Indiana 63
- 3500 E 160 N
- 3148 S Coffing Brothers Rd
- 0 1000 N
- 1 1000 N
- 1000 N 300 W
- 2340 W Hibbs Rd
- 0 1000 N Unit LotWP001
- 0000 Vacant Grd S Main St
- 493 S Main St
- 1938 W
- 22715 E 2650th Rd
- 0 Stringtown South Rd
- 20626 E 1280 North Rd
- 4745 N Main St
- 904 W Ferry St
- 4765 N Main St
- 4768 Anthony Dr
- 4751 Anthony Dr
- 911 W Ferry St
- 4787 N Main St
- 913 W Ferry St
- 917 W Ferry St
- 802 W Ferry St
- 401 N Eugene Ave
- 4791 N Water St
- 333 N Eugene Ave
- 292 W Chestnut St
- 315 N Eugene Ave
- 500 W State Road 234
- 4994 N Main St
- 4863 N Water St
- 221 N Eugene Ave
- 4885 N Water St
Your Personal Tour Guide
Ask me questions while you tour the home.