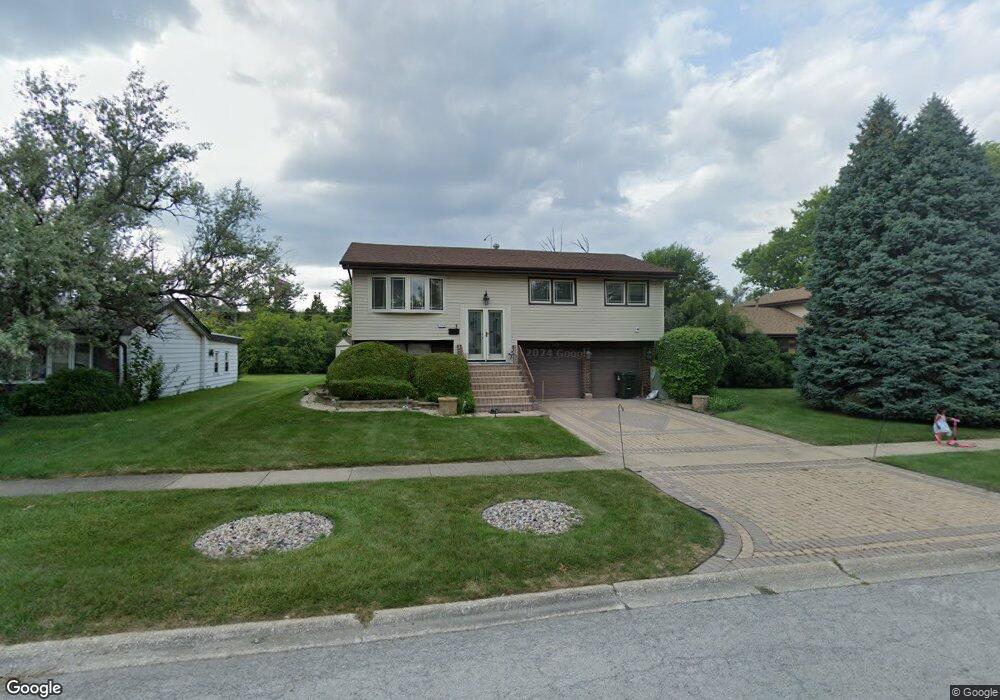
4748 175th Place Country Club Hills, IL 60478
Estimated Value: $194,000 - $221,000
3
Beds
2
Baths
1,120
Sq Ft
$190/Sq Ft
Est. Value
About This Home
This home is located at 4748 175th Place, Country Club Hills, IL 60478 and is currently estimated at $212,707, approximately $189 per square foot. 4748 175th Place is a home located in Cook County with nearby schools including Zenon J Sykuta School, Meadowview Intermediate School, and Southwood Middle School.
Ownership History
Date
Name
Owned For
Owner Type
Purchase Details
Closed on
Aug 27, 2021
Sold by
Broadnax Regina A S
Bought by
Regina A S Broadnax 2018 Trust and Broadnax
Current Estimated Value
Home Financials for this Owner
Home Financials are based on the most recent Mortgage that was taken out on this home.
Original Mortgage
$118,000
Interest Rate
6.42%
Mortgage Type
New Conventional
Purchase Details
Closed on
Jun 15, 2018
Sold by
Broadnax Regina A S
Bought by
Broadnax Regina A S and Regina A S Broadnax 2018 Trust
Purchase Details
Closed on
Sep 29, 1995
Sold by
Broadnax Perry A and Broadnax Regina A S
Bought by
Broadnax Regina A S
Home Financials for this Owner
Home Financials are based on the most recent Mortgage that was taken out on this home.
Original Mortgage
$72,000
Interest Rate
8%
Create a Home Valuation Report for This Property
The Home Valuation Report is an in-depth analysis detailing your home's value as well as a comparison with similar homes in the area
Home Values in the Area
Average Home Value in this Area
Purchase History
| Date | Buyer | Sale Price | Title Company |
|---|---|---|---|
| Regina A S Broadnax 2018 Trust | -- | Indecomm Global Services | |
| Broadnax Regina A | -- | Indecomm Global Services | |
| Broadnax Regina A S | -- | Attorney | |
| Broadnax Regina A S | -- | Ticor Title |
Source: Public Records
Mortgage History
| Date | Status | Borrower | Loan Amount |
|---|---|---|---|
| Previous Owner | Broadnax Regina A | $118,000 | |
| Previous Owner | Broadnax Regina A S | $72,000 |
Source: Public Records
Tax History Compared to Growth
Tax History
| Year | Tax Paid | Tax Assessment Tax Assessment Total Assessment is a certain percentage of the fair market value that is determined by local assessors to be the total taxable value of land and additions on the property. | Land | Improvement |
|---|---|---|---|---|
| 2024 | $5,321 | $14,000 | $3,544 | $10,456 |
| 2023 | $4,343 | $14,000 | $3,544 | $10,456 |
| 2022 | $4,343 | $9,592 | $3,038 | $6,554 |
| 2021 | $4,440 | $9,590 | $3,037 | $6,553 |
| 2020 | $4,678 | $9,590 | $3,037 | $6,553 |
| 2019 | $5,140 | $10,395 | $2,784 | $7,611 |
| 2018 | $4,909 | $10,395 | $2,784 | $7,611 |
| 2017 | $4,864 | $10,395 | $2,784 | $7,611 |
| 2016 | $4,684 | $9,410 | $2,531 | $6,879 |
| 2015 | $4,471 | $9,410 | $2,531 | $6,879 |
| 2014 | $4,427 | $9,410 | $2,531 | $6,879 |
| 2013 | $4,854 | $10,943 | $2,531 | $8,412 |
Source: Public Records
Map
Nearby Homes
- 4656 176th Place
- 4847 175th St
- 17940 Michael Ave
- 4411 177th Place
- 5013 180th St
- 4421 179th St
- 4240 176th St
- 4207 176th Place
- 4826 Summerhill Dr
- 4200 W 176th Place
- 4101 Park Ln Unit 1
- 5125 171st St
- 18300 Lavergne Ave
- 18038 Juneway Ct
- 4101 176th Place
- 5048 171st St
- 4061 177th St
- 18057 Juneway Ct
- 17942 Edwards Ave
- 16938 Cicero Ave
- 4740 175th Place
- 4756 175th Place
- 4764 175th Place
- 4732 175th Place
- 4741 175th Place
- 4749 175th Place
- 4733 175th Place
- 4724 175th Place
- 17600 Larkin Ln
- 4757 175th Place
- 4725 175th Place
- 4716 175th Place
- 17601 Larkin Ln
- 4717 175th Place
- 17606 Larkin Ln
- 4724 176th St
- 4716 176th St
- 4732 176th St
- 4709 175th Place
- 4708 176th St