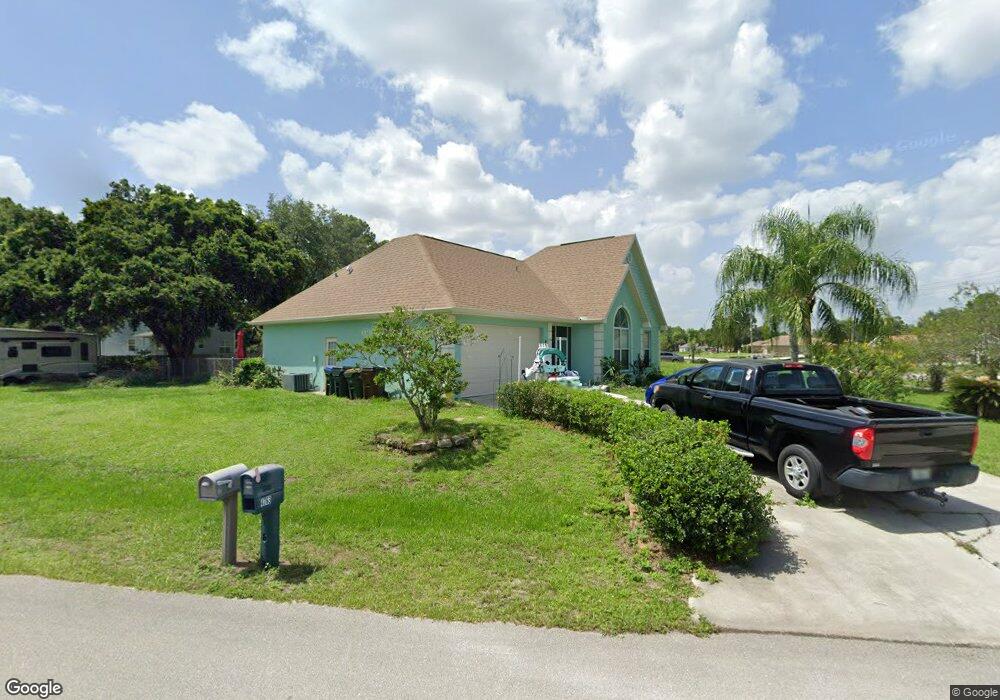
4748 Chamrade Rd North Port, FL 34288
Estimated Value: $246,261 - $293,000
3
Beds
2
Baths
1,996
Sq Ft
$137/Sq Ft
Est. Value
About This Home
This home is located at 4748 Chamrade Rd, North Port, FL 34288 and is currently estimated at $273,815, approximately $137 per square foot. 4748 Chamrade Rd is a home located in Sarasota County with nearby schools including Atwater Elementary School, North Port High School, and Woodland Middle School.
Ownership History
Date
Name
Owned For
Owner Type
Purchase Details
Closed on
Aug 20, 2015
Sold by
Sainsbury Timothy F and Sainsbury Monique
Bought by
Zahlman Donald D and Zahlman Barbara
Current Estimated Value
Home Financials for this Owner
Home Financials are based on the most recent Mortgage that was taken out on this home.
Original Mortgage
$100,000
Outstanding Balance
$76,132
Interest Rate
3.12%
Mortgage Type
Adjustable Rate Mortgage/ARM
Estimated Equity
$197,683
Purchase Details
Closed on
Oct 23, 2001
Sold by
Sainsbury Greg A
Bought by
Sainsbury Timothy F and Sainsbury Monique
Home Financials for this Owner
Home Financials are based on the most recent Mortgage that was taken out on this home.
Original Mortgage
$90,132
Interest Rate
6.57%
Mortgage Type
FHA
Purchase Details
Closed on
May 19, 1999
Sold by
Cumming Clark
Bought by
Sainsbury Greg A
Purchase Details
Closed on
Jan 30, 1997
Sold by
Grant Emeline
Bought by
Cumming Clark
Create a Home Valuation Report for This Property
The Home Valuation Report is an in-depth analysis detailing your home's value as well as a comparison with similar homes in the area
Home Values in the Area
Average Home Value in this Area
Purchase History
| Date | Buyer | Sale Price | Title Company |
|---|---|---|---|
| Zahlman Donald D | $150,100 | Burnt Store Title & Escrow L | |
| Sainsbury Timothy F | $106,000 | -- | |
| Sainsbury Greg A | $94,000 | -- | |
| Cumming Clark | $4,200 | -- |
Source: Public Records
Mortgage History
| Date | Status | Borrower | Loan Amount |
|---|---|---|---|
| Open | Zahlman Donald D | $100,000 | |
| Previous Owner | Sainsbury Timothy F | $90,132 |
Source: Public Records
Tax History Compared to Growth
Tax History
| Year | Tax Paid | Tax Assessment Tax Assessment Total Assessment is a certain percentage of the fair market value that is determined by local assessors to be the total taxable value of land and additions on the property. | Land | Improvement |
|---|---|---|---|---|
| 2024 | $2,515 | $160,631 | -- | -- |
| 2023 | $2,515 | $155,952 | $0 | $0 |
| 2022 | $2,409 | $151,410 | $0 | $0 |
| 2021 | $2,150 | $132,631 | $0 | $0 |
| 2020 | $2,122 | $130,800 | $6,500 | $124,300 |
| 2019 | $2,089 | $129,500 | $7,000 | $122,500 |
| 2018 | $2,511 | $126,000 | $7,100 | $118,900 |
| 2017 | $2,420 | $119,200 | $4,200 | $115,000 |
| 2016 | $2,478 | $120,000 | $3,800 | $116,200 |
| 2015 | $1,087 | $91,300 | $4,100 | $87,200 |
| 2014 | $1,061 | $62,327 | $0 | $0 |
Source: Public Records
Map
Nearby Homes
- 4804 Hader Rd
- 0 Hillman Terrace Unit MFRC7508052
- 2333 Union Ln
- 0 Dragon Lot 8 St Unit MFRC7513107
- 4373 Atwater Dr
- TBD Dragon St
- 0 Fears St Unit MFRN6137817
- 17 Fears St
- Lot 27 Dragon St
- 4876 Germany Ave
- 5366 Hader Rd
- 5009 Jody Ave
- 5092 Ute Ave
- 5120 Ute Ave
- Lot 11 Geary Terrace
- LOT 73 Hungary Rd
- 2 Hungary Rd
- LOTS 18 & 19 Jody Ave
- 5034 Jody Ave
- 4798 Jody Ave
- 4737 Atwater Dr
- 4650 Chamrade Rd
- 4998 Atwater Dr
- 4685 Atwater Dr
- 4715 Chamrade Rd
- 4790 Atwater Dr
- 4842 Atwater Dr
- 4738 Atwater Dr
- 4932 Hader Rd
- 4686 Atwater Dr
- 4998 Hader Rd
- 4916 Hader Rd
- 4607 Atwater Dr
- 4946 Atwater Dr
- 4634 Atwater Dr
- 4823 Kendsha St
- 4679 Kendsha St
- 4871 Kendsha St
- 4507 Atwater Dr
- 4529 Atwater Dr