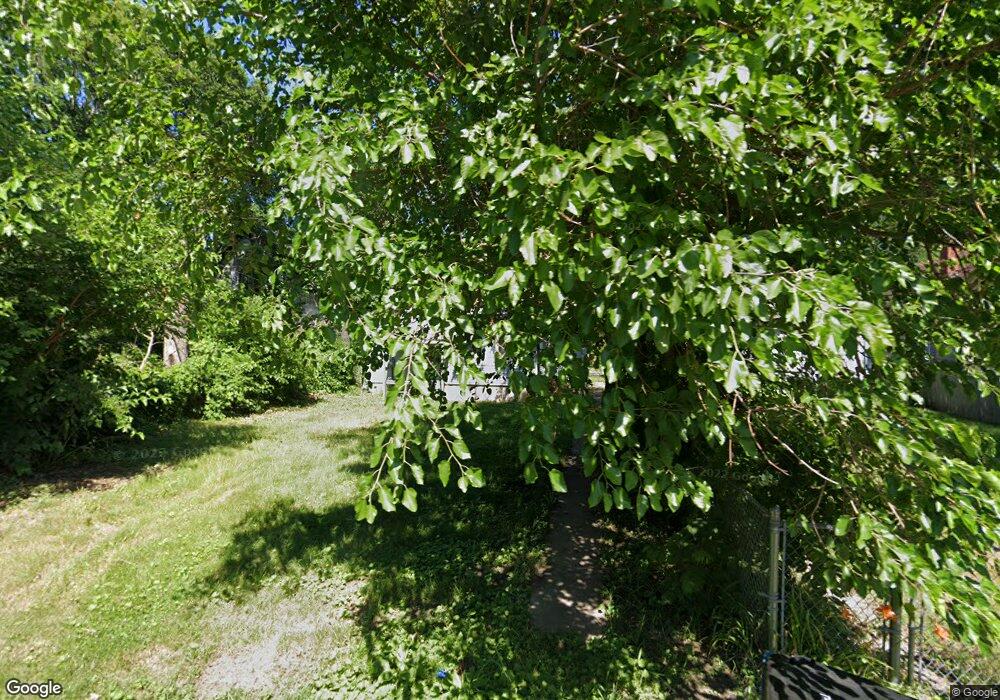
4748 Monroe St Gary, IN 46408
Glen Park NeighborhoodEstimated Value: $114,000 - $155,000
3
Beds
1
Bath
2,148
Sq Ft
$64/Sq Ft
Est. Value
About This Home
This home is located at 4748 Monroe St, Gary, IN 46408 and is currently estimated at $137,497, approximately $64 per square foot. 4748 Monroe St is a home located in Lake County with nearby schools including Glen Park Academy for Excellence in Learning, Bailly Preparatory Academy, and West Side Leadership Academy.
Ownership History
Date
Name
Owned For
Owner Type
Purchase Details
Closed on
Jun 19, 2018
Sold by
First Class Equities Llc
Bought by
1901 Shannon Llc
Current Estimated Value
Purchase Details
Closed on
Dec 21, 2017
Sold by
Reo Logic Indiana Holdings Llc
Bought by
Ibat Holdings In Llc
Purchase Details
Closed on
Sep 22, 2017
Sold by
Reo Logic Indiana Holdings Llc
Bought by
First Class Equities Llc
Purchase Details
Closed on
Aug 27, 2015
Sold by
Us Bank
Bought by
Reo Logic Indiana Holdings Llc
Purchase Details
Closed on
Jul 7, 2015
Sold by
As Good As It Gets Llc
Bought by
Us Bank
Purchase Details
Closed on
Feb 14, 2005
Sold by
Mccune Simon
Bought by
As Good As It Gets Llc
Home Financials for this Owner
Home Financials are based on the most recent Mortgage that was taken out on this home.
Original Mortgage
$65,600
Interest Rate
1.4%
Mortgage Type
Fannie Mae Freddie Mac
Create a Home Valuation Report for This Property
The Home Valuation Report is an in-depth analysis detailing your home's value as well as a comparison with similar homes in the area
Home Values in the Area
Average Home Value in this Area
Purchase History
| Date | Buyer | Sale Price | Title Company |
|---|---|---|---|
| 1901 Shannon Llc | -- | None Available | |
| Ibat Holdings In Llc | -- | None Available | |
| First Class Equities Llc | $1,000 | None Available | |
| Reo Logic Indiana Holdings Llc | -- | None Available | |
| Us Bank | $3,843 | None Available | |
| As Good As It Gets Llc | -- | Chicago Title Insurance Comp |
Source: Public Records
Mortgage History
| Date | Status | Borrower | Loan Amount |
|---|---|---|---|
| Previous Owner | As Good As It Gets Llc | $65,600 |
Source: Public Records
Tax History
| Year | Tax Paid | Tax Assessment Tax Assessment Total Assessment is a certain percentage of the fair market value that is determined by local assessors to be the total taxable value of land and additions on the property. | Land | Improvement |
|---|---|---|---|---|
| 2025 | $1,354 | $85,400 | $11,300 | $74,100 |
| 2024 | $4,259 | $52,000 | $10,800 | $41,200 |
| 2023 | $1,161 | $48,300 | $10,800 | $37,500 |
| 2022 | $1,161 | $45,300 | $7,200 | $38,100 |
| 2021 | $1,079 | $42,100 | $7,200 | $34,900 |
| 2020 | $1,027 | $40,100 | $7,200 | $32,900 |
| 2019 | $1,003 | $44,900 | $7,300 | $37,600 |
| 2018 | $1,142 | $47,400 | $7,500 | $39,900 |
| 2017 | $1,108 | $46,400 | $7,500 | $38,900 |
| 2016 | $1,027 | $48,200 | $7,500 | $40,700 |
| 2014 | $1,641 | $70,100 | $8,800 | $61,300 |
| 2013 | $1,566 | $69,700 | $8,800 | $60,900 |
Source: Public Records
Map
Nearby Homes
- 4810 Monroe St
- 345 W 47th Ave
- 4656 Jefferson Place
- 4647 Harrison St
- 4525 Tyler St
- 4556 Polk St
- 5069 Jefferson St
- 4585-87 Broadway
- 4778 Connecticut St
- 4788 Connecticut St
- 4533 Broadway
- 4525-29 Broadway
- 4601 Buchanan St
- 4383 Monroe St
- 4827 Connecticut St
- 4701 Connecticut St
- 4427 Washington St
- 410 W 52nd Place
- 4365 Adams St
- 4354 Washington St
Your Personal Tour Guide
Ask me questions while you tour the home.