Estimated Value: $380,974 - $406,000
4
Beds
2
Baths
2,200
Sq Ft
$177/Sq Ft
Est. Value
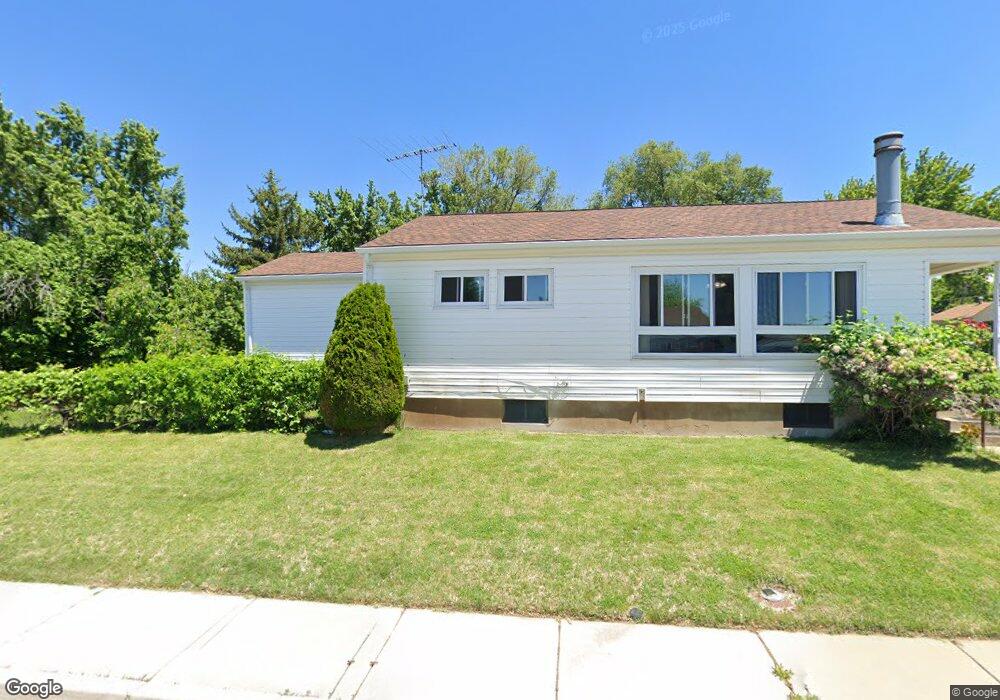
About This Home
This home is located at 4748 S 275 E, Ogden, UT 84405 and is currently estimated at $388,994, approximately $176 per square foot. 4748 S 275 E is a home located in Weber County with nearby schools including Washington Terrace School, T.H. Bell Junior High School, and Bonneville High School.
Ownership History
Date
Name
Owned For
Owner Type
Purchase Details
Closed on
Feb 14, 2020
Sold by
Vough Jonathan
Bought by
Vough Jonathan and Bradshaw Meagan L
Current Estimated Value
Home Financials for this Owner
Home Financials are based on the most recent Mortgage that was taken out on this home.
Original Mortgage
$181,300
Outstanding Balance
$160,528
Interest Rate
3.6%
Mortgage Type
Commercial
Estimated Equity
$228,466
Purchase Details
Closed on
Apr 26, 2018
Sold by
Sylvan And Carol Chesire Marital Liv Tr
Bought by
Vough Jonathan B and Bradshaw Meagan L
Home Financials for this Owner
Home Financials are based on the most recent Mortgage that was taken out on this home.
Original Mortgage
$172,013
Interest Rate
4.44%
Mortgage Type
New Conventional
Purchase Details
Closed on
Sep 5, 2008
Sold by
Cheshire Carol
Bought by
The Sylvan & Carol Chesire Marital Livin and Cheshire Carol
Create a Home Valuation Report for This Property
The Home Valuation Report is an in-depth analysis detailing your home's value as well as a comparison with similar homes in the area
Home Values in the Area
Average Home Value in this Area
Purchase History
| Date | Buyer | Sale Price | Title Company |
|---|---|---|---|
| Vough Jonathan | -- | Us Title Insurance Agency | |
| Vough Jonathan | -- | Us Title Insurance Agency | |
| Vough Jonathan B | -- | Us Title Insurance Agency | |
| The Sylvan & Carol Chesire Marital Livin | -- | None Available |
Source: Public Records
Mortgage History
| Date | Status | Borrower | Loan Amount |
|---|---|---|---|
| Open | Vough Jonathan | $181,300 | |
| Closed | Vough Jonathan B | $172,013 |
Source: Public Records
Tax History
| Year | Tax Paid | Tax Assessment Tax Assessment Total Assessment is a certain percentage of the fair market value that is determined by local assessors to be the total taxable value of land and additions on the property. | Land | Improvement |
|---|---|---|---|---|
| 2025 | $2,513 | $370,070 | $118,943 | $251,127 |
| 2024 | $2,392 | $197,449 | $65,418 | $132,031 |
| 2023 | $2,428 | $201,850 | $63,479 | $138,371 |
| 2022 | $2,502 | $216,150 | $60,753 | $155,397 |
| 2021 | $1,817 | $249,000 | $59,488 | $189,512 |
| 2020 | $1,818 | $229,000 | $48,784 | $180,216 |
| 2019 | $1,733 | $201,000 | $48,784 | $152,216 |
| 2018 | $1,611 | $183,000 | $48,784 | $134,216 |
| 2017 | $918 | $155,000 | $33,529 | $121,471 |
| 2016 | $810 | $73,659 | $17,722 | $55,937 |
| 2015 | $1,246 | $68,191 | $17,722 | $50,469 |
| 2014 | $762 | $67,528 | $17,722 | $49,806 |
Source: Public Records
Map
Nearby Homes
Your Personal Tour Guide
Ask me questions while you tour the home.