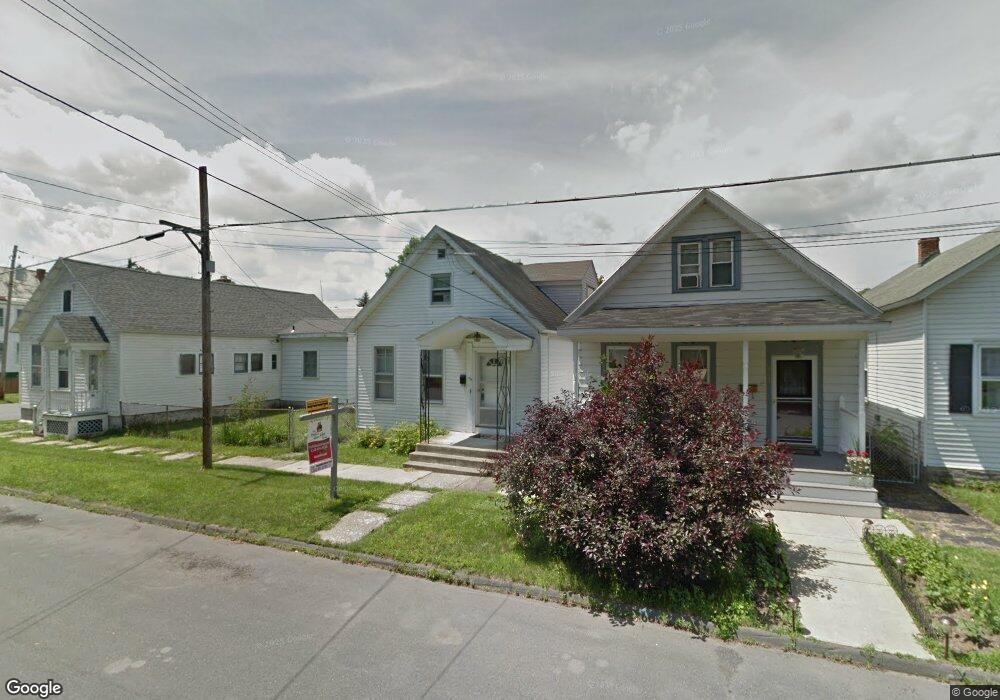
475 9th Ave Troy, NY 12182
Lansingburgh NeighborhoodEstimated Value: $193,000 - $231,000
4
Beds
1
Bath
1,320
Sq Ft
$154/Sq Ft
Est. Value
About This Home
This home is located at 475 9th Ave, Troy, NY 12182 and is currently estimated at $203,454, approximately $154 per square foot. 475 9th Ave is a home located in Rensselaer County with nearby schools including Turnpike Elementary School, Rensselaer Park Elementary School, and Knickerbacker Middle School.
Ownership History
Date
Name
Owned For
Owner Type
Purchase Details
Closed on
Jun 21, 2019
Sold by
Gsc Properties Llc
Bought by
Varner Marva
Current Estimated Value
Home Financials for this Owner
Home Financials are based on the most recent Mortgage that was taken out on this home.
Original Mortgage
$135,304
Interest Rate
4.4%
Mortgage Type
FHA
Purchase Details
Closed on
Aug 3, 2017
Sold by
Gribben Janice
Bought by
Gsc Properties Llc
Purchase Details
Closed on
Nov 1, 2005
Sold by
Gardner
Bought by
Gribben Janice L
Home Financials for this Owner
Home Financials are based on the most recent Mortgage that was taken out on this home.
Original Mortgage
$110,100
Interest Rate
5.93%
Mortgage Type
Purchase Money Mortgage
Purchase Details
Closed on
Jan 28, 2002
Create a Home Valuation Report for This Property
The Home Valuation Report is an in-depth analysis detailing your home's value as well as a comparison with similar homes in the area
Home Values in the Area
Average Home Value in this Area
Purchase History
| Date | Buyer | Sale Price | Title Company |
|---|---|---|---|
| Varner Marva | $137,800 | First American Title | |
| Gsc Properties Llc | $34,037 | -- | |
| Gribben Janice L | $110,100 | Clarles Rosenstein | |
| -- | -- | -- |
Source: Public Records
Mortgage History
| Date | Status | Borrower | Loan Amount |
|---|---|---|---|
| Previous Owner | Varner Marva | $135,304 | |
| Previous Owner | Gribben Janice L | $110,100 |
Source: Public Records
Tax History
| Year | Tax Paid | Tax Assessment Tax Assessment Total Assessment is a certain percentage of the fair market value that is determined by local assessors to be the total taxable value of land and additions on the property. | Land | Improvement |
|---|---|---|---|---|
| 2024 | $5,763 | $113,000 | $8,800 | $104,200 |
| 2023 | $6,863 | $113,000 | $8,800 | $104,200 |
| 2022 | $4,928 | $113,000 | $8,800 | $104,200 |
| 2021 | $1,287 | $113,000 | $8,800 | $104,200 |
| 2020 | $2,329 | $113,000 | $8,800 | $104,200 |
| 2019 | $3,264 | $96,000 | $8,800 | $87,200 |
| 2018 | $3,264 | $96,000 | $8,800 | $87,200 |
| 2017 | $2,940 | $96,000 | $8,800 | $87,200 |
| 2016 | $4,752 | $96,000 | $8,800 | $87,200 |
| 2015 | -- | $96,000 | $8,800 | $87,200 |
| 2014 | -- | $96,000 | $8,800 | $87,200 |
Source: Public Records
Map
Nearby Homes
Your Personal Tour Guide
Ask me questions while you tour the home.