Estimated Value: $150,640 - $185,000
6
Beds
2
Baths
1,776
Sq Ft
$94/Sq Ft
Est. Value
About This Home
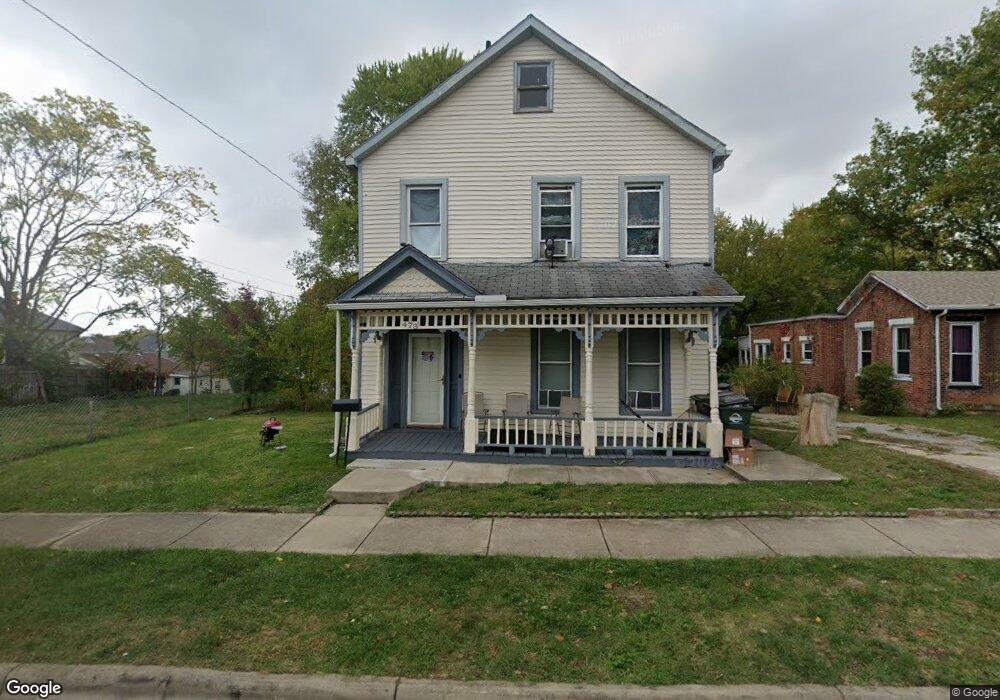
This home is located at 475 Chestnut St, Xenia, OH 45385 and is currently estimated at $166,660, approximately $93 per square foot. 475 Chestnut St is a home located in Greene County with nearby schools including Xenia High School, Summit Academy Community School for Alternative Learners - Xenia, and Legacy Christian Academy.
Ownership History
Date
Name
Owned For
Owner Type
Purchase Details
Closed on
Aug 31, 2015
Sold by
Marr Mike Le and Marr Janet G Le
Bought by
Hosea Investments Llc
Current Estimated Value
Home Financials for this Owner
Home Financials are based on the most recent Mortgage that was taken out on this home.
Original Mortgage
$725,000
Interest Rate
4%
Mortgage Type
Seller Take Back
Purchase Details
Closed on
Jul 29, 2009
Sold by
Lemarr Mike and Lemarr Janet G
Bought by
Hayes Seth and Hayes Leah
Home Financials for this Owner
Home Financials are based on the most recent Mortgage that was taken out on this home.
Original Mortgage
$757,000
Interest Rate
7.25%
Mortgage Type
Seller Take Back
Purchase Details
Closed on
Mar 1, 1988
Bought by
Le Marr Mike
Create a Home Valuation Report for This Property
The Home Valuation Report is an in-depth analysis detailing your home's value as well as a comparison with similar homes in the area
Home Values in the Area
Average Home Value in this Area
Purchase History
| Date | Buyer | Sale Price | Title Company |
|---|---|---|---|
| Hosea Investments Llc | $745,000 | Attorney | |
| Hayes Seth | $777,000 | None Available | |
| Le Marr Mike | $5,700 | -- |
Source: Public Records
Mortgage History
| Date | Status | Borrower | Loan Amount |
|---|---|---|---|
| Closed | Hosea Investments Llc | $725,000 | |
| Closed | Hayes Seth | $757,000 |
Source: Public Records
Tax History Compared to Growth
Tax History
| Year | Tax Paid | Tax Assessment Tax Assessment Total Assessment is a certain percentage of the fair market value that is determined by local assessors to be the total taxable value of land and additions on the property. | Land | Improvement |
|---|---|---|---|---|
| 2024 | $1,534 | $35,850 | $5,220 | $30,630 |
| 2023 | $1,534 | $35,850 | $5,220 | $30,630 |
| 2022 | $1,367 | $27,240 | $4,170 | $23,070 |
| 2021 | $1,385 | $27,240 | $4,170 | $23,070 |
| 2020 | $1,327 | $27,240 | $4,170 | $23,070 |
| 2019 | $1,374 | $26,560 | $4,800 | $21,760 |
| 2018 | $1,380 | $26,560 | $4,800 | $21,760 |
| 2017 | $1,322 | $26,560 | $4,800 | $21,760 |
| 2016 | $1,323 | $24,990 | $4,800 | $20,190 |
| 2015 | $1,327 | $24,990 | $4,800 | $20,190 |
| 2014 | $1,270 | $24,990 | $4,800 | $20,190 |
Source: Public Records
Map
Nearby Homes