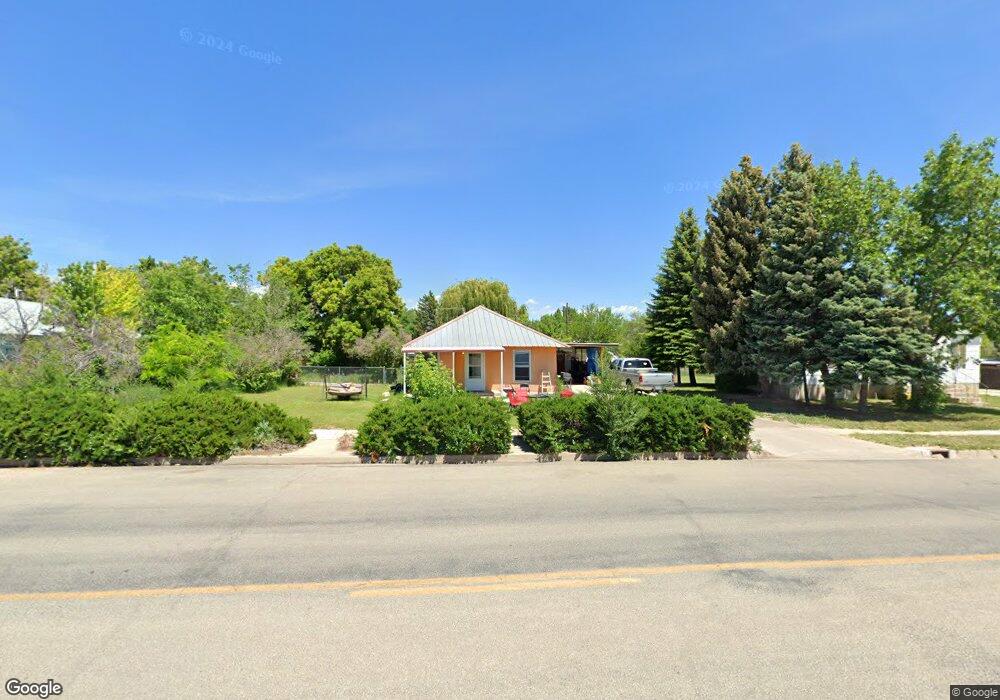
475 E 100 N Vernal, UT 84078
Estimated Value: $220,000 - $244,261
2
Beds
1
Bath
1,104
Sq Ft
$213/Sq Ft
Est. Value
About This Home
This home is located at 475 E 100 N, Vernal, UT 84078 and is currently estimated at $235,565, approximately $213 per square foot. 475 E 100 N is a home located in Uintah County with nearby schools including Naples School, Vernal Middle School, and Uintah Middle School.
Ownership History
Date
Name
Owned For
Owner Type
Purchase Details
Closed on
Feb 22, 2012
Sold by
Samuels Brian and Samuels Chelina
Bought by
Samuels Brian
Current Estimated Value
Purchase Details
Closed on
Nov 12, 2008
Sold by
Hadlock June B
Bought by
Samuels Brian
Home Financials for this Owner
Home Financials are based on the most recent Mortgage that was taken out on this home.
Original Mortgage
$138,077
Outstanding Balance
$90,592
Interest Rate
6.07%
Mortgage Type
FHA
Estimated Equity
$144,973
Purchase Details
Closed on
May 18, 2007
Sold by
Hadlock June B
Bought by
Hacking Sharon H and Hadlock Terry J
Create a Home Valuation Report for This Property
The Home Valuation Report is an in-depth analysis detailing your home's value as well as a comparison with similar homes in the area
Purchase History
| Date | Buyer | Sale Price | Title Company |
|---|---|---|---|
| Samuels Brian | -- | Basin Land Title & Abstract | |
| Samuels Brian | -- | -- | |
| Samuels Brian | -- | -- | |
| Hacking Sharon H | -- | -- |
Source: Public Records
Mortgage History
| Date | Status | Borrower | Loan Amount |
|---|---|---|---|
| Open | Samuels Brian | $138,077 | |
| Closed | Samuels Brian | $138,077 |
Source: Public Records
Tax History
| Year | Tax Paid | Tax Assessment Tax Assessment Total Assessment is a certain percentage of the fair market value that is determined by local assessors to be the total taxable value of land and additions on the property. | Land | Improvement |
|---|---|---|---|---|
| 2024 | $936 | $104,381 | $18,301 | $86,080 |
| 2023 | $919 | $83,991 | $17,749 | $66,242 |
| 2022 | $764 | $70,743 | $17,749 | $52,994 |
| 2021 | $796 | $60,833 | $17,749 | $43,084 |
| 2020 | $763 | $59,988 | $17,749 | $42,239 |
| 2019 | $799 | $62,019 | $19,250 | $42,769 |
| 2018 | $774 | $59,982 | $19,250 | $40,732 |
| 2017 | $8 | $62,732 | $22,000 | $40,732 |
| 2016 | $804 | $68,658 | $22,000 | $46,658 |
| 2015 | $743 | $68,658 | $22,000 | $46,658 |
| 2014 | $733 | $68,658 | $22,000 | $46,658 |
| 2013 | $749 | $68,658 | $22,000 | $46,658 |
Source: Public Records
Map
Nearby Homes
- 190 N 500 E Unit A202
- 190 N 500 E Unit A101
- 190 N 500 E Unit A206
- 190 N 500 E Unit A406
- 190 N 500 E Unit A304
- 190 N 500 E Unit A403
- 190 N 500 E Unit A301
- 190 N 500 E Unit A105
- 561 E 250 N
- 535 E 600 N
- 609 E 600 N
- 576 E 600 N Unit 4
- 235 S 100 E
- 277 E 700 N
- 150 E 750 N Unit 109
- 150 E 750 N Unit 71
- 150 E 750 N Unit 116
- 119 W 500 N
- 117 W 100 S
- 2425 N Vernal Ave
Your Personal Tour Guide
Ask me questions while you tour the home.