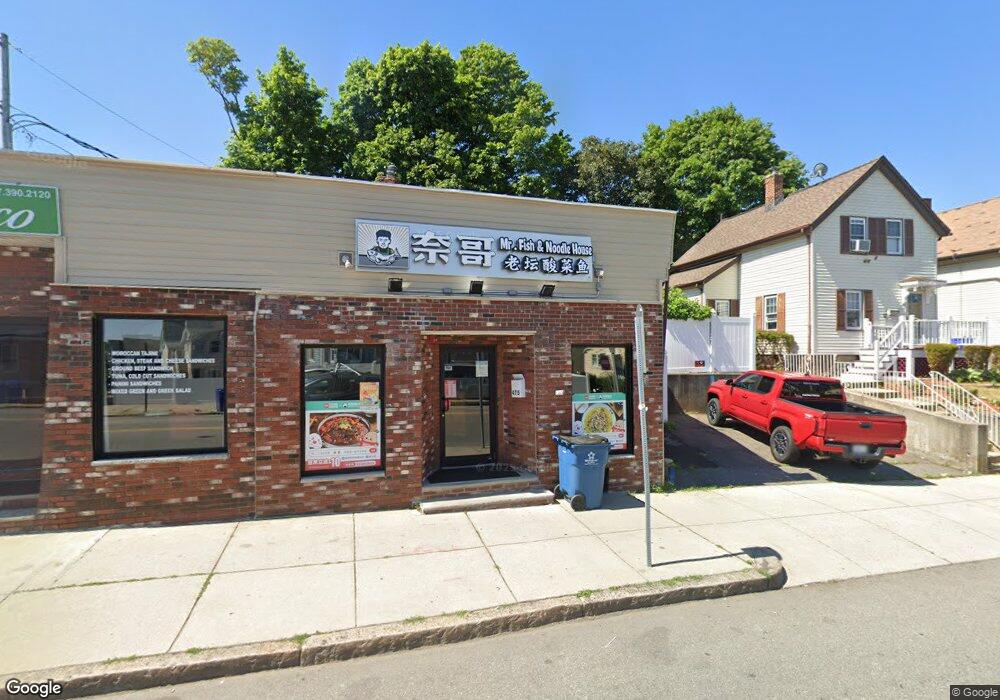
475 Ferry St Malden, MA 02148
Belmont NeighborhoodEstimated Value: $1,241,673
Studio
2
Baths
3,323
Sq Ft
$374/Sq Ft
Est. Value
About This Home
This home is located at 475 Ferry St, Malden, MA 02148 and is currently estimated at $1,241,673, approximately $373 per square foot. 475 Ferry St is a home located in Middlesex County with nearby schools including Malden High School and Cheverus Centennial School.
Ownership History
Date
Name
Owned For
Owner Type
Purchase Details
Closed on
Apr 7, 2016
Sold by
Fusco Dennis L and Fusco Christine
Bought by
475 and 481 Ferry L
Current Estimated Value
Home Financials for this Owner
Home Financials are based on the most recent Mortgage that was taken out on this home.
Original Mortgage
$330,000
Outstanding Balance
$261,647
Interest Rate
3.62%
Mortgage Type
Commercial
Estimated Equity
$980,026
Create a Home Valuation Report for This Property
The Home Valuation Report is an in-depth analysis detailing your home's value as well as a comparison with similar homes in the area
Home Values in the Area
Average Home Value in this Area
Purchase History
| Date | Buyer | Sale Price | Title Company |
|---|---|---|---|
| 475 | $440,000 | -- |
Source: Public Records
Mortgage History
| Date | Status | Borrower | Loan Amount |
|---|---|---|---|
| Open | 475 | $330,000 |
Source: Public Records
Tax History
| Year | Tax Paid | Tax Assessment Tax Assessment Total Assessment is a certain percentage of the fair market value that is determined by local assessors to be the total taxable value of land and additions on the property. | Land | Improvement |
|---|---|---|---|---|
| 2025 | $164 | $936,700 | $382,900 | $553,800 |
| 2024 | $11,706 | $643,200 | $361,600 | $281,600 |
| 2023 | $11,354 | $607,800 | $345,700 | $262,100 |
| 2022 | $10,818 | $564,300 | $313,800 | $250,500 |
| 2021 | $10,458 | $546,400 | $297,800 | $248,600 |
| 2020 | $10,111 | $516,400 | $287,200 | $229,200 |
| 2019 | $9,828 | $478,700 | $255,300 | $223,400 |
| 2018 | $9,334 | $427,400 | $234,000 | $193,400 |
| 2017 | $11,256 | $510,700 | $234,000 | $276,700 |
| 2016 | $11,483 | $484,100 | $212,700 | $271,400 |
| 2015 | $11,834 | $479,300 | $175,500 | $303,800 |
| 2014 | $12,256 | $479,300 | $175,500 | $303,800 |
Source: Public Records
Map
Nearby Homes
- 19 Mills St
- 13 Coolidge St
- 272-274 Cross St Unit 1
- 272-274 Cross St Unit 4
- 272-274 Cross St Unit 3
- 272-274 Cross St Unit 5
- 272-274 Cross St Unit 2
- 132 Vernal St
- 40-42 Upham St Unit 1
- 21 Central Ave Unit 10
- 210 Hancock St
- 378 Ferry St
- 21 Staples Ave Unit 26
- 12 Holloway St
- 859 Broadway Unit 15
- 89 Judson St
- 881 Broadway Unit 44
- 4 Cross St Unit 1
- 51 Thurman St
- 80 Main St Unit 4
- 481 Ferry St
- 471 Ferry St
- 478 Ferry St
- 248 Belmont St Unit 2
- 248 Belmont St Unit 1
- 467 Ferry St
- 467 Ferry St Unit ID1385718P
- 467 Ferry St Unit 2
- 462 Ferry St
- 242 Belmont St
- 244 Belmont St
- 484 Ferry St
- 251 Belmont St
- 488 Ferry St
- 490 Ferry St
- 488-490 Ferry St
- 459 Ferry St
- 14 Ferry Street Place
- 10 Mills St
- 247 Belmont St