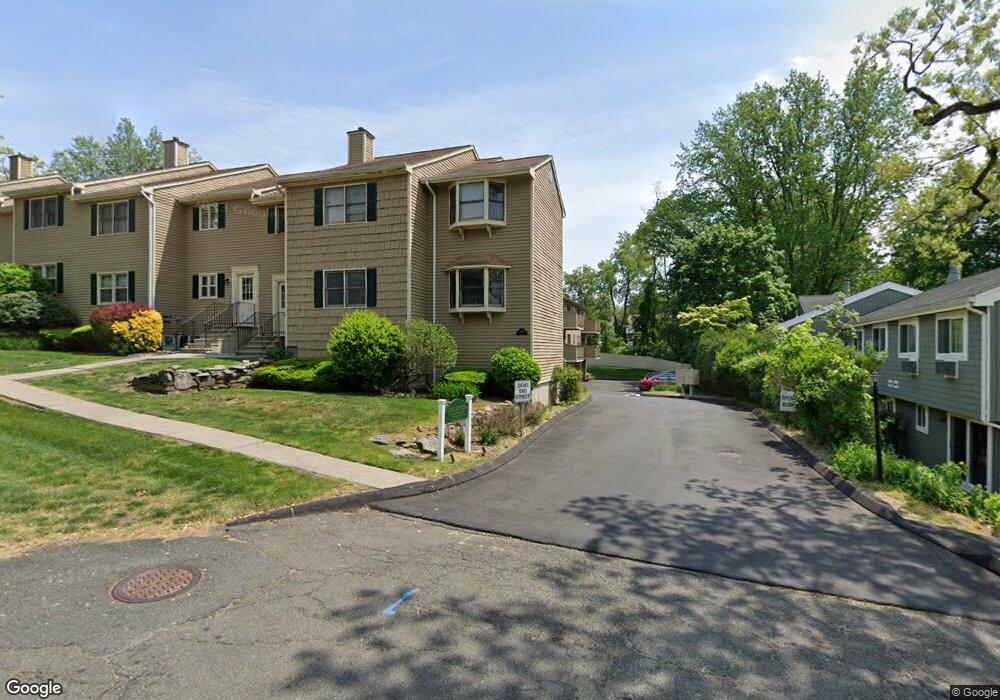
475 Glendale Ave Unit 20 Bridgeport, CT 06606
North End NeighborhoodEstimated Value: $228,000 - $298,000
1
Bed
1
Bath
883
Sq Ft
$285/Sq Ft
Est. Value
About This Home
This home is located at 475 Glendale Ave Unit 20, Bridgeport, CT 06606 and is currently estimated at $251,244, approximately $284 per square foot. 475 Glendale Ave Unit 20 is a home located in Fairfield County with nearby schools including John Winthrop School, Central High School, and St Andrew School.
Ownership History
Date
Name
Owned For
Owner Type
Purchase Details
Closed on
Mar 30, 2007
Sold by
Procaccini Tricia
Bought by
Mulligan Brian
Current Estimated Value
Home Financials for this Owner
Home Financials are based on the most recent Mortgage that was taken out on this home.
Original Mortgage
$108,000
Outstanding Balance
$65,944
Interest Rate
6.33%
Estimated Equity
$185,300
Purchase Details
Closed on
Jul 26, 2004
Sold by
Kahn Lori
Bought by
Procaccini Tricia
Home Financials for this Owner
Home Financials are based on the most recent Mortgage that was taken out on this home.
Original Mortgage
$137,750
Interest Rate
5.25%
Purchase Details
Closed on
Jul 14, 1998
Sold by
Fhlmc
Bought by
Kahn Lori
Purchase Details
Closed on
Feb 28, 1989
Sold by
Hetrick Douglas
Bought by
Appelberg Neil
Create a Home Valuation Report for This Property
The Home Valuation Report is an in-depth analysis detailing your home's value as well as a comparison with similar homes in the area
Home Values in the Area
Average Home Value in this Area
Purchase History
| Date | Buyer | Sale Price | Title Company |
|---|---|---|---|
| Mulligan Brian | $160,000 | -- | |
| Mulligan Brian | $160,000 | -- | |
| Procaccini Tricia | $145,000 | -- | |
| Procaccini Tricia | $145,000 | -- | |
| Kahn Lori | $35,000 | -- | |
| Kahn Lori | $35,000 | -- | |
| Appelberg Neil | $100,000 | -- |
Source: Public Records
Mortgage History
| Date | Status | Borrower | Loan Amount |
|---|---|---|---|
| Open | Appelberg Neil | $108,000 | |
| Closed | Appelberg Neil | $108,000 | |
| Previous Owner | Appelberg Neil | $137,750 |
Source: Public Records
Tax History Compared to Growth
Tax History
| Year | Tax Paid | Tax Assessment Tax Assessment Total Assessment is a certain percentage of the fair market value that is determined by local assessors to be the total taxable value of land and additions on the property. | Land | Improvement |
|---|---|---|---|---|
| 2025 | $3,793 | $87,300 | $0 | $87,300 |
| 2024 | $3,793 | $87,300 | $0 | $87,300 |
| 2023 | $3,793 | $87,300 | $0 | $87,300 |
| 2022 | $3,793 | $87,300 | $0 | $87,300 |
| 2021 | $3,793 | $87,300 | $0 | $87,300 |
| 2020 | $3,726 | $69,020 | $0 | $69,020 |
| 2019 | $3,726 | $69,020 | $0 | $69,020 |
| 2018 | $3,753 | $69,020 | $0 | $69,020 |
| 2017 | $3,753 | $69,020 | $0 | $69,020 |
| 2016 | $3,753 | $69,020 | $0 | $69,020 |
| 2015 | $4,019 | $95,240 | $0 | $95,240 |
| 2014 | $4,019 | $95,240 | $0 | $95,240 |
Source: Public Records
Map
Nearby Homes
- 495 Peet St
- 81 Ameridge Dr
- 38 Enid St Unit B
- 12 Riverview Dr Unit 12
- 245 Glendale Ave Unit D8
- 375 Ruth St
- 339 Goldenrod Ave
- 288 Sunrise Terrace
- 333 Vincellette St Unit 109
- 17 Teresa Place Unit 17
- 200 Woodmont Ave Unit 100
- 2800 Madison Ave Unit 1B
- 2346 Madison Ave
- 69 Plankton St
- 720 Queen St
- 72 Herald Ave
- 605 Merritt St
- 230 Cherry Hill Dr Unit 1A
- 230 Cherry Hill Dr Unit 2B
- 15 Cherry Hill Dr Unit 2A
- 475 Glendale Ave Unit 19
- 475 Glendale Ave Unit 18
- 475 Glendale Ave Unit 17
- 485 Glendale Ave Unit 8
- 485 Glendale Ave Unit 7
- 485 Glendale Ave Unit 6
- 485 Glendale Ave Unit 5
- 485 Glendale Ave Unit 4
- 485 Glendale Ave Unit 2
- 485 Glendale Ave Unit 1
- 495 Glendale Ave Unit 16
- 495 Glendale Ave Unit 15
- 495 Glendale Ave Unit 14
- 495 Glendale Ave Unit 12A
- 495 Glendale Ave Unit 12
- 495 Glendale Ave Unit 11
- 495 Glendale Ave Unit 10
- 495 Glendale Ave Unit 9
- 480 Glendale Ave Unit 26
- 51 Ameridge Dr