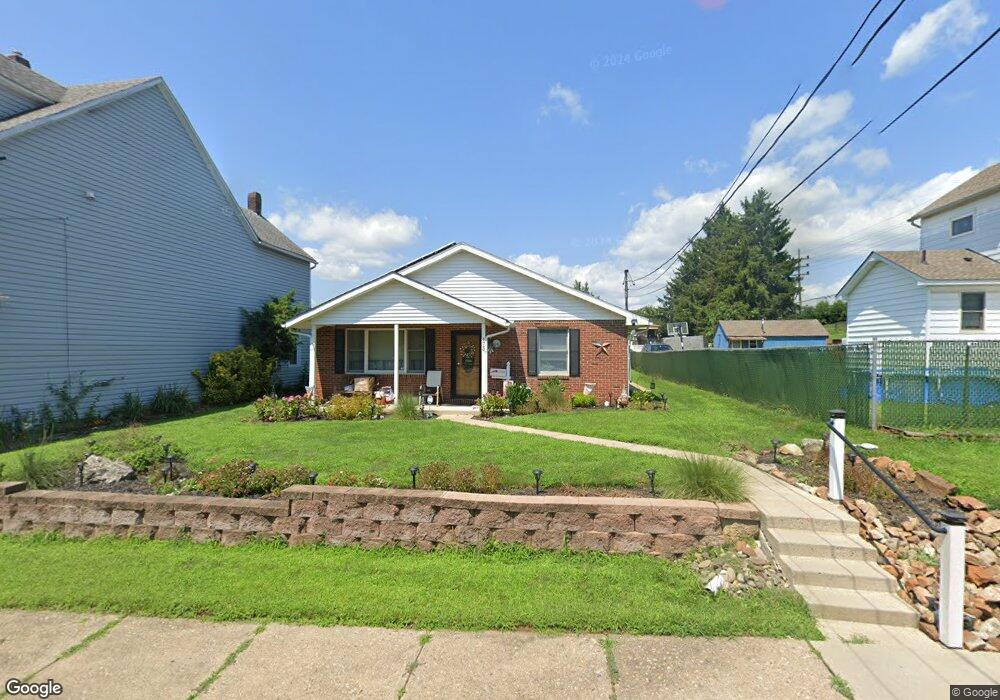
475 James St Phillipsburg, NJ 08865
Estimated Value: $233,585 - $309,000
--
Bed
--
Bath
1,376
Sq Ft
$195/Sq Ft
Est. Value
About This Home
This home is located at 475 James St, Phillipsburg, NJ 08865 and is currently estimated at $268,396, approximately $195 per square foot. 475 James St is a home located in Warren County with nearby schools including Phillipsburg High School, Easton Arts Academy Elementary Cs, and Sts. Philip & James School.
Ownership History
Date
Name
Owned For
Owner Type
Purchase Details
Closed on
Aug 20, 1998
Sold by
Hauck Jack A and Hauck Evelyn M
Bought by
Hunara James M and Hunara Janette
Current Estimated Value
Home Financials for this Owner
Home Financials are based on the most recent Mortgage that was taken out on this home.
Original Mortgage
$105,400
Outstanding Balance
$21,950
Interest Rate
6.9%
Estimated Equity
$246,446
Purchase Details
Closed on
Mar 18, 1997
Sold by
Dellatore James T and Dellatore Donna L
Bought by
Hauck Jack A and Hauck Evelyn M
Create a Home Valuation Report for This Property
The Home Valuation Report is an in-depth analysis detailing your home's value as well as a comparison with similar homes in the area
Home Values in the Area
Average Home Value in this Area
Purchase History
| Date | Buyer | Sale Price | Title Company |
|---|---|---|---|
| Hunara James M | $105,800 | -- | |
| Hauck Jack A | $25,000 | -- |
Source: Public Records
Mortgage History
| Date | Status | Borrower | Loan Amount |
|---|---|---|---|
| Open | Hunara James M | $105,400 |
Source: Public Records
Tax History Compared to Growth
Tax History
| Year | Tax Paid | Tax Assessment Tax Assessment Total Assessment is a certain percentage of the fair market value that is determined by local assessors to be the total taxable value of land and additions on the property. | Land | Improvement |
|---|---|---|---|---|
| 2025 | $5,286 | $116,300 | $29,100 | $87,200 |
| 2024 | $4,880 | $116,300 | $29,100 | $87,200 |
| 2023 | $4,824 | $116,300 | $29,100 | $87,200 |
| 2022 | $4,824 | $116,300 | $29,100 | $87,200 |
| 2021 | $4,669 | $116,300 | $29,100 | $87,200 |
| 2020 | $4,701 | $116,300 | $29,100 | $87,200 |
| 2019 | $4,630 | $116,300 | $29,100 | $87,200 |
| 2018 | $4,630 | $116,300 | $29,100 | $87,200 |
| 2017 | $4,609 | $116,300 | $29,100 | $87,200 |
| 2016 | $4,538 | $116,300 | $29,100 | $87,200 |
| 2015 | $4,503 | $116,300 | $29,100 | $87,200 |
| 2014 | $4,357 | $116,300 | $29,100 | $87,200 |
Source: Public Records
Map
Nearby Homes