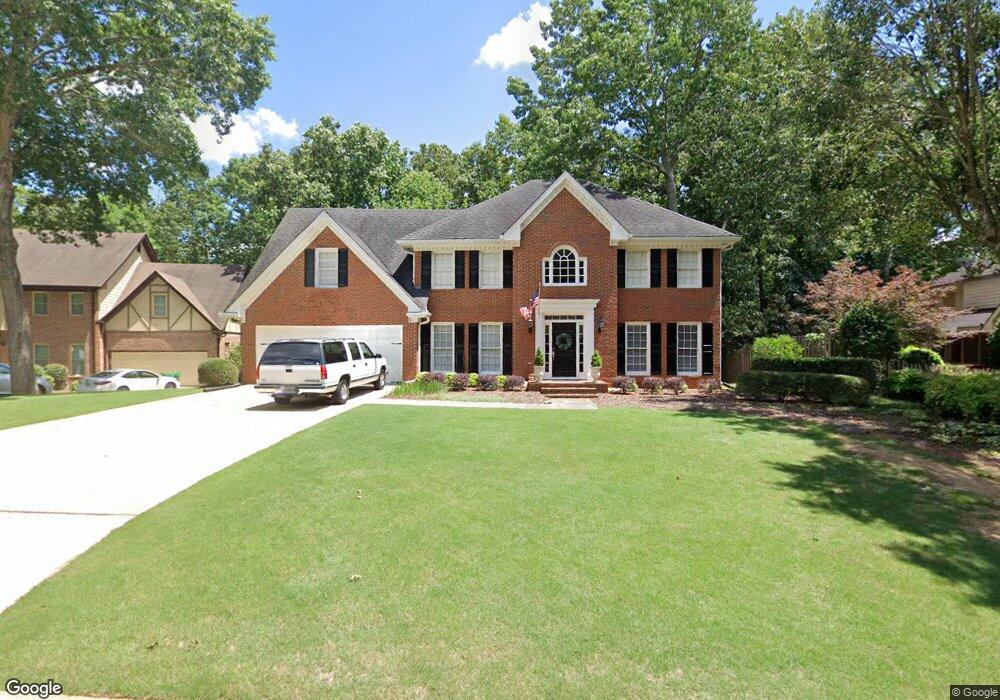
475 Prince Charles Place Unit 3 Alpharetta, GA 30022
Newtown NeighborhoodEstimated Value: $659,000 - $761,000
4
Beds
4
Baths
2,926
Sq Ft
$238/Sq Ft
Est. Value
About This Home
This home is located at 475 Prince Charles Place Unit 3, Alpharetta, GA 30022 and is currently estimated at $696,727, approximately $238 per square foot. 475 Prince Charles Place Unit 3 is a home located in Fulton County with nearby schools including Hillside Elementary School, Haynes Bridge Middle School, and Centennial High School.
Ownership History
Date
Name
Owned For
Owner Type
Purchase Details
Closed on
Apr 10, 2003
Sold by
Frank Mark D
Bought by
Frank Mark D and Frank Beth
Current Estimated Value
Home Financials for this Owner
Home Financials are based on the most recent Mortgage that was taken out on this home.
Original Mortgage
$236,500
Interest Rate
5.6%
Mortgage Type
New Conventional
Purchase Details
Closed on
Jul 15, 1994
Sold by
Winograd Marc Carol L
Bought by
Frank Mark D Beth A
Home Financials for this Owner
Home Financials are based on the most recent Mortgage that was taken out on this home.
Original Mortgage
$230,000
Interest Rate
7.25%
Create a Home Valuation Report for This Property
The Home Valuation Report is an in-depth analysis detailing your home's value as well as a comparison with similar homes in the area
Home Values in the Area
Average Home Value in this Area
Purchase History
| Date | Buyer | Sale Price | Title Company |
|---|---|---|---|
| Frank Mark D | -- | -- | |
| Frank Mark D | -- | -- | |
| Frank Mark D Beth A | $245,000 | -- |
Source: Public Records
Mortgage History
| Date | Status | Borrower | Loan Amount |
|---|---|---|---|
| Closed | Frank Mark D | $236,500 | |
| Closed | Frank Mark D | $25,000 | |
| Previous Owner | Frank Mark D Beth A | $230,000 |
Source: Public Records
Tax History Compared to Growth
Tax History
| Year | Tax Paid | Tax Assessment Tax Assessment Total Assessment is a certain percentage of the fair market value that is determined by local assessors to be the total taxable value of land and additions on the property. | Land | Improvement |
|---|---|---|---|---|
| 2025 | $4,445 | $220,560 | $67,800 | $152,760 |
| 2023 | $6,121 | $216,840 | $54,240 | $162,600 |
| 2022 | $4,268 | $195,200 | $45,880 | $149,320 |
| 2021 | $4,236 | $183,400 | $34,040 | $149,360 |
| 2020 | $4,258 | $165,520 | $38,400 | $127,120 |
| 2019 | $511 | $168,640 | $37,200 | $131,440 |
| 2018 | $4,504 | $155,240 | $58,520 | $96,720 |
| 2017 | $4,170 | $134,680 | $51,400 | $83,280 |
| 2016 | $4,102 | $134,680 | $51,400 | $83,280 |
| 2015 | $4,146 | $134,680 | $51,400 | $83,280 |
| 2014 | $3,985 | $126,040 | $28,920 | $97,120 |
Source: Public Records
Map
Nearby Homes
- 835 Kings Arms Way
- 3535 Merganser Ln Unit 2
- 140 Old Sandhurst Landing
- 9320 Brumbelow Crossing Way
- 3450 Merganser Ln
- 710 Leeds Garden Terrace
- 9510 Stoney Ridge Ln
- 150 Stoney Ridge Dr
- 280 Vidaulan Ct
- 440 Guildhall Grove Unit 2
- 2910 Leeds Garden Ln
- 9675 Almaviva Dr
- 125 Georgian Manor Ct
- 235 Stoney Ridge Dr
- 2935 Georgian Manor Dr
- 375 N Peak Dr
- 9695 Almaviva Dr
- 485 Prince Charles Place Unit III
- 510 Argylls Crest
- 495 Prince Charles Place
- 480 Prince Charles Place
- 460 Prince Charles Place Unit 3
- 470 Prince Charles Place
- 450 Prince Charles Place Unit 3
- 3420 Arborwoods Dr
- 3180 Hartridge Dr Unit 1
- 3430 Arborwoods Dr Unit 1
- 525 Argylls Crest
- 3440 Arborwoods Dr
- 445 Prince Charles Place
- 3190 Hartridge Dr
- 515 Argylls Crest
- 650 Saint Fillans Ct
- 3170 Hartridge Dr
- 3200 Hartridge Dr Unit 1
- 660 Saint Fillans Ct
- 640 Saint Fillans Ct