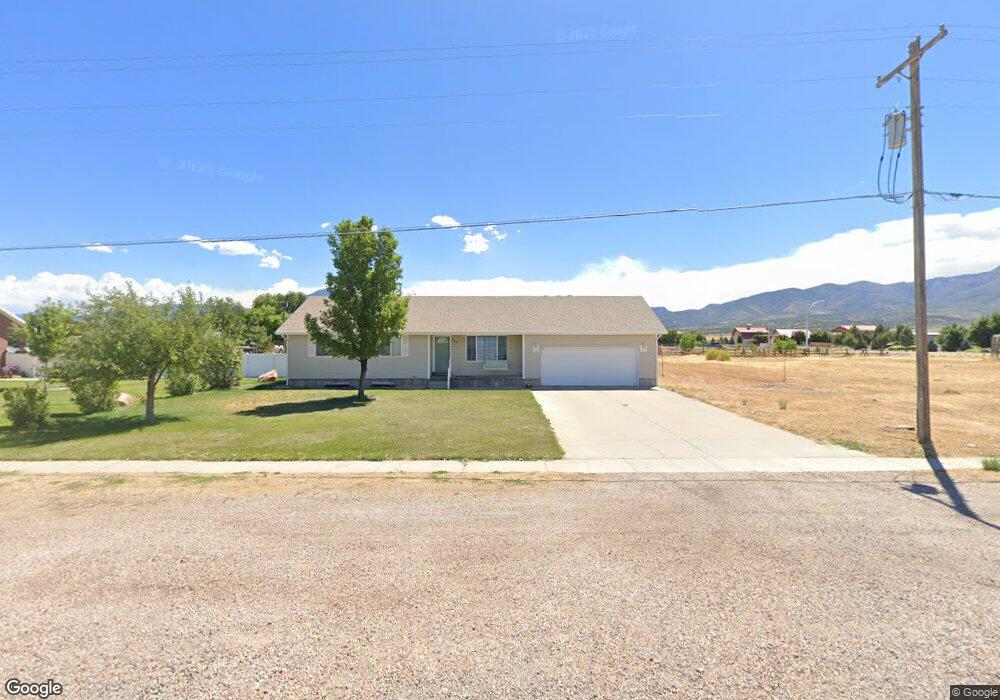
475 S 400 W Fillmore, UT 84631
Estimated Value: $283,000 - $323,000
--
Bed
--
Bath
--
Sq Ft
0.32
Acres
About This Home
This home is located at 475 S 400 W, Fillmore, UT 84631 and is currently estimated at $300,405. 475 S 400 W is a home.
Ownership History
Date
Name
Owned For
Owner Type
Purchase Details
Closed on
Oct 31, 2025
Sold by
Warner Steven Weston
Bought by
Warner Steven Weston and Warner Vikki
Current Estimated Value
Purchase Details
Closed on
Aug 22, 2025
Sold by
Warner Marilee
Bought by
Warner Steven Weston
Home Financials for this Owner
Home Financials are based on the most recent Mortgage that was taken out on this home.
Original Mortgage
$198,921
Interest Rate
6.3%
Mortgage Type
FHA
Purchase Details
Closed on
Aug 3, 2005
Sold by
Warner Jerrold Weston and Warner Vikki
Bought by
Warner Steven Weston and Warner Marliee
Home Financials for this Owner
Home Financials are based on the most recent Mortgage that was taken out on this home.
Original Mortgage
$111,200
Interest Rate
5.56%
Create a Home Valuation Report for This Property
The Home Valuation Report is an in-depth analysis detailing your home's value as well as a comparison with similar homes in the area
Home Values in the Area
Average Home Value in this Area
Purchase History
| Date | Buyer | Sale Price | Title Company |
|---|---|---|---|
| Warner Steven Weston | -- | Juab Title & Abstract | |
| Warner Steven Weston | -- | Juab Title & Abstract | |
| Warner Steven Weston | -- | -- |
Source: Public Records
Mortgage History
| Date | Status | Borrower | Loan Amount |
|---|---|---|---|
| Previous Owner | Warner Steven Weston | $198,921 | |
| Previous Owner | Warner Steven Weston | $111,200 |
Source: Public Records
Tax History Compared to Growth
Tax History
| Year | Tax Paid | Tax Assessment Tax Assessment Total Assessment is a certain percentage of the fair market value that is determined by local assessors to be the total taxable value of land and additions on the property. | Land | Improvement |
|---|---|---|---|---|
| 2025 | $1,175 | $147,627 | $23,020 | $124,607 |
| 2024 | $1,175 | $132,452 | $20,292 | $112,160 |
| 2023 | $1,453 | $132,452 | $20,292 | $112,160 |
| 2022 | $1,169 | $104,959 | $18,448 | $86,511 |
| 2021 | $1,023 | $88,191 | $11,979 | $76,212 |
| 2020 | $947 | $82,159 | $10,890 | $71,269 |
| 2019 | $807 | $70,238 | $10,890 | $59,348 |
| 2018 | $770 | $68,564 | $10,890 | $57,674 |
| 2017 | $695 | $58,840 | $10,890 | $47,950 |
| 2016 | $665 | $58,840 | $10,890 | $47,950 |
| 2015 | $665 | $58,840 | $10,890 | $47,950 |
| 2014 | -- | $58,840 | $10,890 | $47,950 |
| 2013 | -- | $58,840 | $10,890 | $47,950 |
Source: Public Records
Map
Nearby Homes