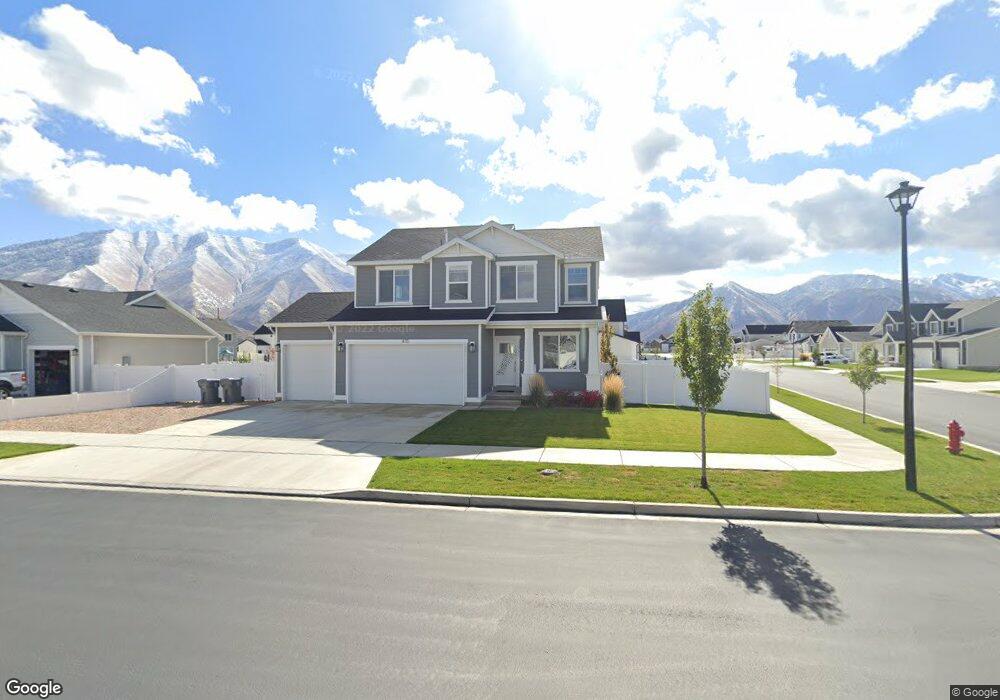
475 S Grant St Unit 36 Mapleton, UT 84664
Estimated Value: $681,810 - $791,000
3
Beds
3
Baths
3,000
Sq Ft
$245/Sq Ft
Est. Value
About This Home
This home is located at 475 S Grant St Unit 36, Mapleton, UT 84664 and is currently estimated at $734,270, approximately $244 per square foot. 475 S Grant St Unit 36 is a home located in Utah County with nearby schools including Maple Ridge Elementary, Mapleton Junior High School, and Maple Mountain High School.
Ownership History
Date
Name
Owned For
Owner Type
Purchase Details
Closed on
Oct 29, 2021
Sold by
Johnson Zachary T and Johnson Erin M
Bought by
Johnson Erin M and Johnson Zachary T
Current Estimated Value
Home Financials for this Owner
Home Financials are based on the most recent Mortgage that was taken out on this home.
Original Mortgage
$517,500
Outstanding Balance
$471,444
Interest Rate
2.88%
Mortgage Type
New Conventional
Estimated Equity
$262,826
Purchase Details
Closed on
Apr 29, 2021
Sold by
Blanton Danny and Blanton Patricia
Bought by
Johnson Zachary T and Johnson Erin M
Home Financials for this Owner
Home Financials are based on the most recent Mortgage that was taken out on this home.
Original Mortgage
$513,000
Interest Rate
3%
Mortgage Type
New Conventional
Purchase Details
Closed on
Jul 1, 2019
Sold by
D R Horton Inc
Bought by
Blanton Danny and Blanton Patricia
Home Financials for this Owner
Home Financials are based on the most recent Mortgage that was taken out on this home.
Original Mortgage
$368,991
Interest Rate
3.8%
Mortgage Type
New Conventional
Create a Home Valuation Report for This Property
The Home Valuation Report is an in-depth analysis detailing your home's value as well as a comparison with similar homes in the area
Home Values in the Area
Average Home Value in this Area
Purchase History
| Date | Buyer | Sale Price | Title Company |
|---|---|---|---|
| Johnson Erin M | -- | Union Title | |
| Johnson Zachary T | -- | Pro Title & Escrow Inc | |
| Blanton Danny | -- | Cottonwood Ttl Ins Agcy Inc |
Source: Public Records
Mortgage History
| Date | Status | Borrower | Loan Amount |
|---|---|---|---|
| Open | Johnson Erin M | $517,500 | |
| Previous Owner | Johnson Zachary T | $513,000 | |
| Previous Owner | Blanton Danny | $368,991 |
Source: Public Records
Tax History
| Year | Tax Paid | Tax Assessment Tax Assessment Total Assessment is a certain percentage of the fair market value that is determined by local assessors to be the total taxable value of land and additions on the property. | Land | Improvement |
|---|---|---|---|---|
| 2025 | $2,982 | $329,120 | -- | -- |
| 2024 | $2,982 | $292,105 | $0 | $0 |
| 2023 | $3,072 | $302,885 | $0 | $0 |
| 2022 | $3,251 | $316,855 | $0 | $0 |
| 2021 | $2,712 | $405,800 | $162,000 | $243,800 |
| 2020 | $2,653 | $384,000 | $147,300 | $236,700 |
| 2019 | $2,500 | $369,400 | $143,300 | $226,100 |
| 2018 | $1,852 | $143,300 | $143,300 | $0 |
Source: Public Records
Map
Nearby Homes
- 572 S Chamberlain St
- 442 S Doubleday St
- 674 S Meade St
- 2216 W Silver Leaf Dr Unit 35
- 934 N Laredo Dr
- 1058 S Lilac Way
- 812 N Old Fort Dr
- 906 S Crescent Way
- 1164 N Ponderosa Ln
- 2567 E 830 N
- 768 N Old Fort Dr
- 2559 W Aurora Ave Unit 292
- 2720 W Aurora Ave
- 2770 W Aurora Ave
- 2814 W Aurora Ave Unit 339
- 2796 W Aurora Ave
- 2820 W Aurora Ave
- 80 S Moonlit Rd
- 77 S Lunar Way Unit 385
- 76-307 S Crimson Way
- 475 S Grant St
- 467 S Grant St
- 577 S Grant St
- 538 S Grant St Unit 40
- 538 S Grant St
- 456 S Grant St
- 564 S Grant St Unit 41
- 564 S Grant St
- 466 S Grant St
- 455 S Grant St Unit 70
- 455 S Grant St
- 593 S Grant St
- 452 S Grant St
- 492 S Grant St Unit 39
- 582 S Grant St Unit 42
- 582 S Doubleday St Unit 26
- 606 S Grant St
- 606 S Grant St Unit 43
- 447 S Grant St
- 629 S Grant St Unit 33
Your Personal Tour Guide
Ask me questions while you tour the home.