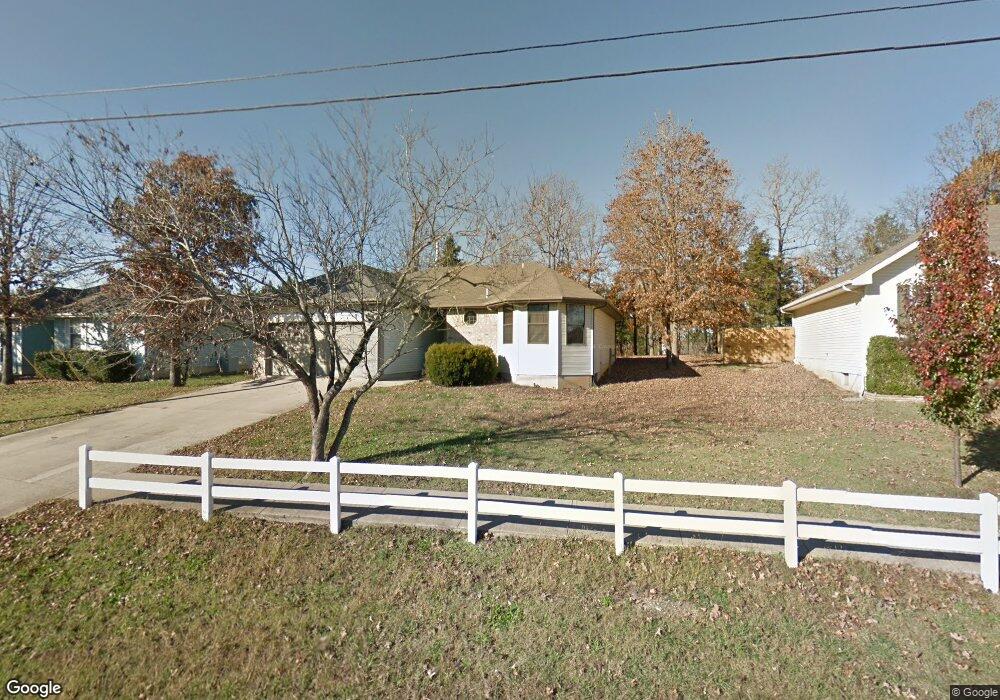
475 Shary View Rd Branson, MO 65616
Estimated Value: $235,530 - $246,000
3
Beds
2
Baths
1,269
Sq Ft
$190/Sq Ft
Est. Value
About This Home
This home is located at 475 Shary View Rd, Branson, MO 65616 and is currently estimated at $240,633, approximately $189 per square foot. 475 Shary View Rd is a home located in Taney County with nearby schools including Buchanan Intermediate School, Buchanan Elementary School, and Branson Junior High School.
Ownership History
Date
Name
Owned For
Owner Type
Purchase Details
Closed on
Oct 26, 2012
Sold by
77 Shiloh Street Llc
Bought by
Hein Angleine R and Hein Christopher L
Current Estimated Value
Purchase Details
Closed on
Sep 23, 2011
Sold by
Fannie Mae
Bought by
Garrison Preston
Home Financials for this Owner
Home Financials are based on the most recent Mortgage that was taken out on this home.
Original Mortgage
$87,979
Interest Rate
4.24%
Mortgage Type
New Conventional
Purchase Details
Closed on
Jan 31, 2011
Sold by
Robinson Development Co Llc
Bought by
77 Shiloh Street Llc
Purchase Details
Closed on
Oct 15, 2008
Sold by
Hisaw Kimberly D Walker and Hisaw Shannon
Bought by
Mefford Kimberly Dawn
Purchase Details
Closed on
Oct 23, 2006
Sold by
Royale Tpt Properties Llc
Bought by
Rainey Wayne H and Rainey Martia L
Purchase Details
Closed on
Sep 7, 2005
Sold by
Spl Development Llc
Bought by
Zhang Li and Xu Helen
Create a Home Valuation Report for This Property
The Home Valuation Report is an in-depth analysis detailing your home's value as well as a comparison with similar homes in the area
Home Values in the Area
Average Home Value in this Area
Purchase History
| Date | Buyer | Sale Price | Title Company |
|---|---|---|---|
| Hein Angleine R | -- | None Available | |
| Garrison Preston | -- | -- | |
| 77 Shiloh Street Llc | -- | None Available | |
| Mefford Kimberly Dawn | -- | None Available | |
| Hisaw Kimberly D Walker | -- | -- | |
| Rainey Wayne H | -- | -- | |
| Zhang Li | -- | -- |
Source: Public Records
Mortgage History
| Date | Status | Borrower | Loan Amount |
|---|---|---|---|
| Previous Owner | Garrison Preston | $87,979 | |
| Closed | Rainey Wayne H | $0 |
Source: Public Records
Tax History Compared to Growth
Tax History
| Year | Tax Paid | Tax Assessment Tax Assessment Total Assessment is a certain percentage of the fair market value that is determined by local assessors to be the total taxable value of land and additions on the property. | Land | Improvement |
|---|---|---|---|---|
| 2025 | $1,030 | $17,620 | -- | -- |
| 2023 | $1,030 | $19,860 | $0 | $0 |
| 2022 | $1,001 | $19,860 | $0 | $0 |
| 2021 | $996 | $19,860 | $0 | $0 |
| 2019 | $925 | $17,980 | $0 | $0 |
| 2018 | $927 | $17,980 | $0 | $0 |
| 2017 | $867 | $16,990 | $0 | $0 |
| 2016 | $865 | $16,990 | $0 | $0 |
| 2015 | $858 | $16,990 | $0 | $0 |
| 2014 | $793 | $16,410 | $0 | $0 |
Source: Public Records
Map
Nearby Homes
- 150 Bull Run Rd
- 280 Sharyhill Rd
- 282 Clay St
- 102 Shiloh St
- 195 Waterloo Way
- 000 Rinehart Rd
- 156 Sunrise Villa Dr
- 314 Easy St
- 175 Sunrise Villa Dr
- 196 Sunrise Villa Dr
- 188 Sunrise Villa Dr
- 180 Sunrise Villa Dr
- 164 Sunrise Villa Dr
- 150 Sunrise Villa Dr
- 399 Summerbrooke Ln
- 300 Summerbrooke Ln
- 964 Beeler Rd
- 1420 Bee Creek Rd
- 1394 Bee Creek Rd
- 1467 Bee Creek Rd
- 485 Shary View Rd
- 463 Shary View Rd
- 203 Kiier Ct
- 495 Shary View Rd
- 105 Richmond Heights Blvd
- 589 Shary View Rd
- 109 Richmond Heights Blvd
- 180 Kiier Ct
- 104 Richmond Heights Blvd
- 113 Richmond Heights Blvd
- 590 Shary View Rd
- 151 Sharyhill Rd
- 630 Shary View Rd
- 118 Richmond Heights Blvd
- 289 Kiier Ct
- 119 Richmond Heights Blvd
- 305 Kiier Ct
- 120 Kiiedon Ct
- 122 Richmond Heights Blvd
- 152 Bull Run Rd