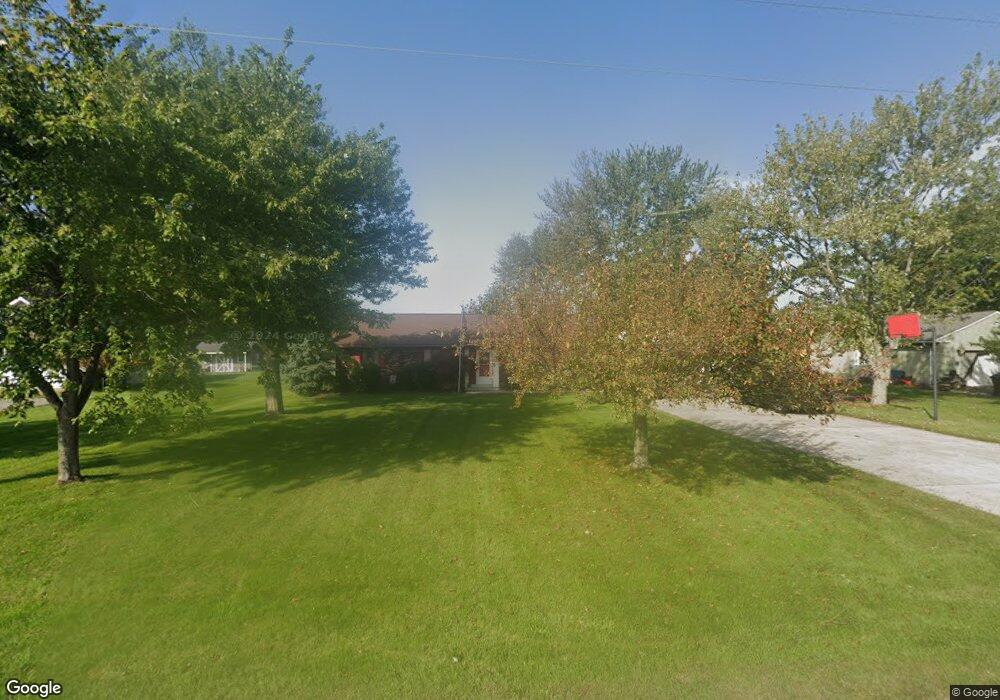
475 Sunderland Rd N Delphos, OH 45833
Estimated Value: $181,000 - $239,000
4
Beds
2
Baths
1,840
Sq Ft
$120/Sq Ft
Est. Value
About This Home
This home is located at 475 Sunderland Rd N, Delphos, OH 45833 and is currently estimated at $220,712, approximately $119 per square foot. 475 Sunderland Rd N is a home with nearby schools including Spencerville Elementary School, Spencerville Middle School, and Spencerville High School.
Ownership History
Date
Name
Owned For
Owner Type
Purchase Details
Closed on
Sep 22, 2005
Sold by
Rodden Bruce and Rodden Tammy
Bought by
Moore John D and Moore Elizabeth M
Current Estimated Value
Home Financials for this Owner
Home Financials are based on the most recent Mortgage that was taken out on this home.
Original Mortgage
$138,800
Outstanding Balance
$75,003
Interest Rate
6.01%
Mortgage Type
New Conventional
Estimated Equity
$145,709
Purchase Details
Closed on
Oct 12, 1995
Sold by
Monfort Thomas
Bought by
Rodden Bruce and Rodden Tammy
Home Financials for this Owner
Home Financials are based on the most recent Mortgage that was taken out on this home.
Original Mortgage
$56,000
Interest Rate
7.8%
Mortgage Type
New Conventional
Purchase Details
Closed on
Jan 1, 1977
Bought by
Monfort Thomas A
Create a Home Valuation Report for This Property
The Home Valuation Report is an in-depth analysis detailing your home's value as well as a comparison with similar homes in the area
Home Values in the Area
Average Home Value in this Area
Purchase History
| Date | Buyer | Sale Price | Title Company |
|---|---|---|---|
| Moore John D | $131,000 | None Available | |
| Rodden Bruce | $76,000 | -- | |
| Monfort Thomas A | $38,000 | -- |
Source: Public Records
Mortgage History
| Date | Status | Borrower | Loan Amount |
|---|---|---|---|
| Open | Moore John D | $138,800 | |
| Previous Owner | Rodden Bruce | $56,000 |
Source: Public Records
Tax History Compared to Growth
Tax History
| Year | Tax Paid | Tax Assessment Tax Assessment Total Assessment is a certain percentage of the fair market value that is determined by local assessors to be the total taxable value of land and additions on the property. | Land | Improvement |
|---|---|---|---|---|
| 2024 | $1,806 | $57,650 | $7,770 | $49,880 |
| 2023 | $1,514 | $44,350 | $5,990 | $38,360 |
| 2022 | $1,555 | $44,350 | $5,990 | $38,360 |
| 2021 | $1,546 | $44,350 | $5,990 | $38,360 |
| 2020 | $1,347 | $37,490 | $5,500 | $31,990 |
| 2019 | $1,347 | $37,490 | $5,500 | $31,990 |
| 2018 | $1,315 | $37,490 | $5,500 | $31,990 |
| 2017 | $1,270 | $34,590 | $5,500 | $29,090 |
| 2016 | $1,242 | $34,590 | $5,500 | $29,090 |
| 2015 | $1,140 | $34,590 | $5,500 | $29,090 |
| 2014 | $1,140 | $32,450 | $5,220 | $27,230 |
| 2013 | $1,156 | $32,450 | $5,220 | $27,230 |
Source: Public Records
Map
Nearby Homes
- 1069 S Kemp Rd
- 5825 Poling Rd
- 1734 Woodberry Creek Dr
- 1784 Woodberry Creek Dr
- 200 Fraunfelter Rd S
- 251 Timberfield Dr N
- 845 Atalan Trail
- 4875 Wenatchi Trail
- 5280 Lobo St
- 4803 Kitamat Trail
- 550 Tonkawa Trail
- 5103 Hummingbird St
- 2733 Lilly Dr
- 5126 Pheasant St
- 7470 Fort Amanda Rd
- 3838 Kemp Rd N
- 2922 Dutch Hollow Rd
- 4917 Pheasant St
- 4901 Hummingbird St
- 6726 Elida Rd
- 485 Sunderland Rd N
- 453 Sunderland Rd N
- 588 Sunderland Rd N
- 8350 Shaffer Rd
- 415 Sunderland Rd N
- 393 Sunderland Rd N
- 8400 Shaffer Rd
- 375 Sunderland Rd N
- 8629 Shaffer Rd
- 135 Sunderland Rd N
- 8701 Shaffer Rd
- 100 Sunderland Rd N
- 8545 Allentown Rd
- 694 N Wapak Rd
- 8877 Shaffer Rd
- 8617 Allentown Rd
- 7977 Allentown Rd