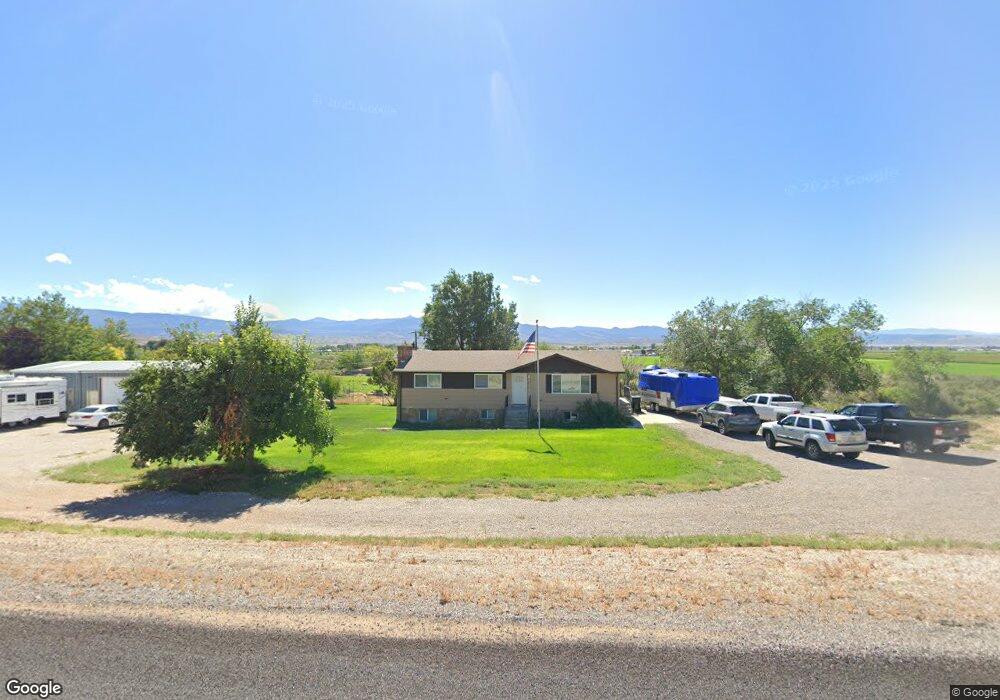
475 W 100 S Gunnison, UT 84634
Gunnison NeighborhoodEstimated Value: $348,000 - $463,000
5
Beds
3
Baths
2,400
Sq Ft
$161/Sq Ft
Est. Value
About This Home
This home is located at 475 W 100 S, Gunnison, UT 84634 and is currently estimated at $385,566, approximately $160 per square foot. 475 W 100 S is a home located in Sanpete County.
Ownership History
Date
Name
Owned For
Owner Type
Purchase Details
Closed on
Oct 21, 2020
Sold by
Sorensen Tyler L and Sorensen Amber L
Bought by
Brown Joshua
Current Estimated Value
Home Financials for this Owner
Home Financials are based on the most recent Mortgage that was taken out on this home.
Original Mortgage
$246,525
Outstanding Balance
$218,871
Interest Rate
2.8%
Mortgage Type
Construction
Estimated Equity
$166,695
Purchase Details
Closed on
Dec 7, 2011
Sold by
Fannie Mae
Bought by
Sorensen Tyler L and Sorensen Amber L
Create a Home Valuation Report for This Property
The Home Valuation Report is an in-depth analysis detailing your home's value as well as a comparison with similar homes in the area
Home Values in the Area
Average Home Value in this Area
Purchase History
| Date | Buyer | Sale Price | Title Company |
|---|---|---|---|
| Brown Joshua | $308,156 | Central Utah Title | |
| Sorensen Tyler L | -- | -- |
Source: Public Records
Mortgage History
| Date | Status | Borrower | Loan Amount |
|---|---|---|---|
| Open | Brown Joshua | $246,525 |
Source: Public Records
Tax History Compared to Growth
Tax History
| Year | Tax Paid | Tax Assessment Tax Assessment Total Assessment is a certain percentage of the fair market value that is determined by local assessors to be the total taxable value of land and additions on the property. | Land | Improvement |
|---|---|---|---|---|
| 2024 | $1,716 | $155,475 | $0 | $0 |
| 2023 | $1,718 | $145,293 | $0 | $0 |
| 2022 | $1,661 | $129,726 | $0 | $0 |
| 2021 | $1,579 | $106,685 | $0 | $0 |
| 2020 | $1,480 | $93,750 | $0 | $0 |
| 2019 | $1,413 | $87,310 | $0 | $0 |
| 2018 | $1,321 | $140,937 | $33,946 | $106,991 |
| 2017 | $1,253 | $77,515 | $0 | $0 |
| 2016 | $1,180 | $73,016 | $0 | $0 |
| 2015 | $1,182 | $73,016 | $0 | $0 |
| 2014 | $1,163 | $73,016 | $0 | $0 |
| 2013 | $1,155 | $72,696 | $0 | $0 |
Source: Public Records
Map
Nearby Homes