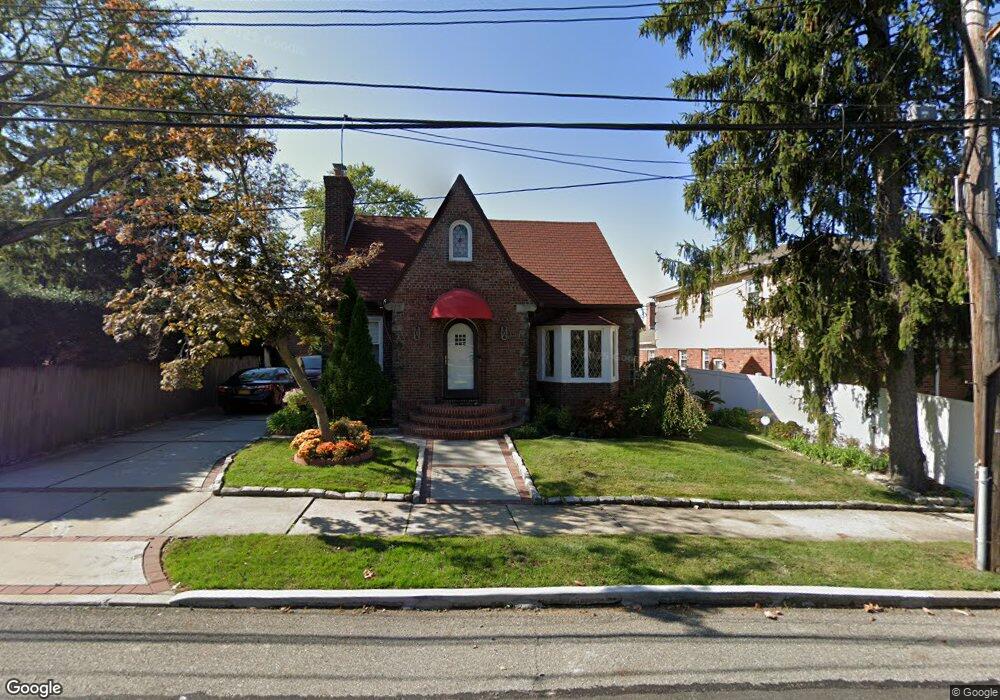
4750 243rd St Little Neck, NY 11362
Douglaston NeighborhoodEstimated Value: $1,230,190 - $1,427,000
--
Bed
--
Bath
2,025
Sq Ft
$664/Sq Ft
Est. Value
About This Home
This home is located at 4750 243rd St, Little Neck, NY 11362 and is currently estimated at $1,343,798, approximately $663 per square foot. 4750 243rd St is a home located in Queens County with nearby schools including P.S. 098 The Douglaston School, Louis Pasteur Middle School 67, and Benjamin N Cardozo High School.
Ownership History
Date
Name
Owned For
Owner Type
Purchase Details
Closed on
Sep 24, 2010
Sold by
1998 Trust Dated December 30 1998 and Mabel N Yu Trustee Of The Mabel N Yu
Bought by
Wan Nancy
Current Estimated Value
Purchase Details
Closed on
Apr 18, 2004
Sold by
Trustee Of Mabel Yu 1998 Trust Dated 12 and Yu
Bought by
Mabel Yu 1998 Trust Dated 1 1998
Purchase Details
Closed on
Aug 29, 2003
Sold by
Wan David and Wan Nancy
Bought by
Yu Mabel N
Purchase Details
Closed on
Jun 5, 2001
Sold by
Kesner Lorraine
Bought by
Wan David and Wan Nancy
Home Financials for this Owner
Home Financials are based on the most recent Mortgage that was taken out on this home.
Original Mortgage
$275,000
Interest Rate
7.2%
Create a Home Valuation Report for This Property
The Home Valuation Report is an in-depth analysis detailing your home's value as well as a comparison with similar homes in the area
Home Values in the Area
Average Home Value in this Area
Purchase History
| Date | Buyer | Sale Price | Title Company |
|---|---|---|---|
| Wan Nancy | $680,000 | -- | |
| Wan Nancy | $680,000 | -- | |
| Mabel Yu 1998 Trust Dated 1 1998 | -- | -- | |
| Mabel Yu 1998 Trust Dated 1 1998 | -- | -- | |
| Yu Mabel N | $680,000 | -- | |
| Yu Mabel N | $680,000 | -- | |
| Wan David | -- | -- | |
| Wan David | -- | -- |
Source: Public Records
Mortgage History
| Date | Status | Borrower | Loan Amount |
|---|---|---|---|
| Previous Owner | Wan David | $275,000 |
Source: Public Records
Tax History Compared to Growth
Tax History
| Year | Tax Paid | Tax Assessment Tax Assessment Total Assessment is a certain percentage of the fair market value that is determined by local assessors to be the total taxable value of land and additions on the property. | Land | Improvement |
|---|---|---|---|---|
| 2025 | $12,939 | $69,769 | $14,602 | $55,167 |
| 2024 | $7,002 | $65,820 | $17,907 | $47,913 |
| 2023 | $6,486 | $67,390 | $14,388 | $53,002 |
| 2022 | $5,390 | $74,580 | $16,500 | $58,080 |
| 2021 | $12,941 | $71,640 | $16,500 | $55,140 |
| 2020 | $13,018 | $75,360 | $16,500 | $58,860 |
| 2019 | $12,160 | $83,040 | $16,500 | $66,540 |
| 2018 | $11,150 | $56,158 | $14,001 | $42,157 |
| 2017 | $10,500 | $52,980 | $16,500 | $36,480 |
| 2016 | $10,169 | $52,980 | $16,500 | $36,480 |
| 2015 | $6,075 | $52,416 | $15,125 | $37,291 |
| 2014 | $6,075 | $50,424 | $17,457 | $32,967 |
Source: Public Records
Map
Nearby Homes
- 52-04 Redfield St
- 5211 Redfield St
- 50-15 245th St
- 5022 Overbrook St
- 53-21 240th St
- 242-52 Horace Harding Expy Unit 2
- 242-52 Horace Harding Expy Unit A
- 56- 10 244th St Unit 1
- 57-21 246th Crescent Unit B2-7 Upper
- 57-21 246th Crescent Unit 1FL
- 248-14 Deepdale Ave
- 241-20 Northern Blvd Unit 6E
- 241-20 Northern Blvd Unit 3 H
- 241-20 Northern Blvd Unit 2H
- 241-20 Northern Blvd Unit 6H
- 241-20 Northern Blvd Unit 2B
- 241-20 Northern Blvd Unit 5E
- 241-20 Northern Blvd Unit 1M
- 241-20 Northern Blvd Unit 2C
- 24120 Northern Blvd Unit 4C
- 242-34 Barrows Ct
- 24234 Barrows Ct
- 24224 Barrows Ct
- 24227 Van Zandt Ave
- 24223 Van Zandt Ave
- 24217 Van Zandt Ave
- 24220 Barrows Ct
- 4743 243rd St
- 4739 243rd St
- 242-11 Van Zandt Ave
- 47-43 243rd St
- 24305 Van Zandt Ave
- 24211 Van Zandt Ave
- 24235 Barrows Ct
- 24227 Barrows Ct
- 243-05 Van Zandt Ave
- 4737 243rd St
- 242-23 Barrows Ct
- 24223 Barrows Ct
- 24214 Barrows Ct