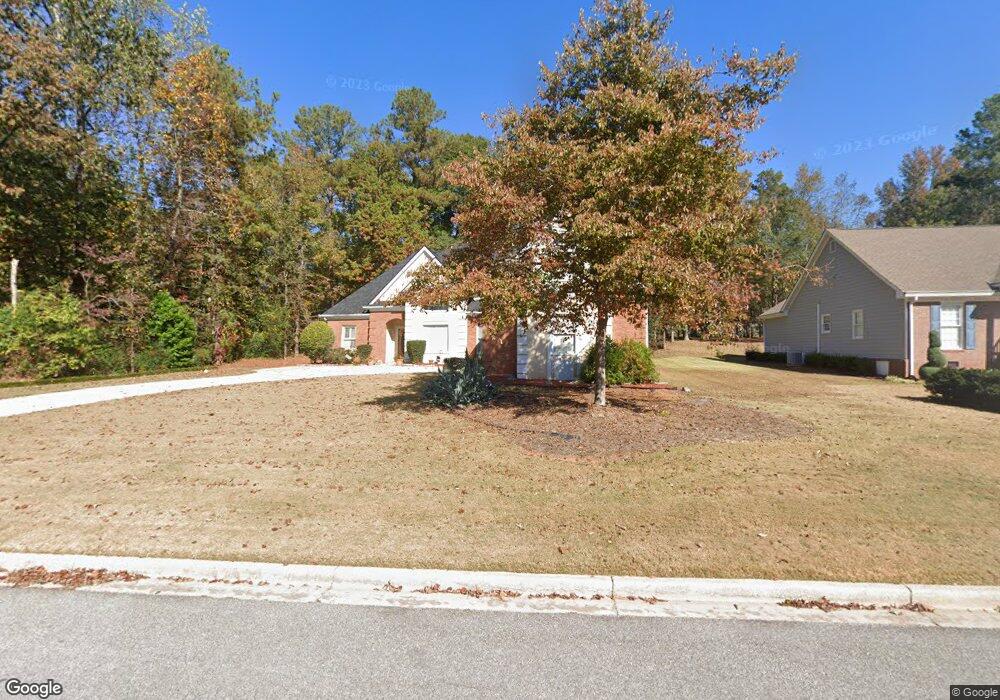
4750 Habersham Way SE Conyers, GA 30094
Estimated Value: $301,000 - $364,000
3
Beds
2
Baths
2,002
Sq Ft
$162/Sq Ft
Est. Value
About This Home
This home is located at 4750 Habersham Way SE, Conyers, GA 30094 and is currently estimated at $324,893, approximately $162 per square foot. 4750 Habersham Way SE is a home located in Rockdale County with nearby schools including Barksdale Elementary School, Gen. Ray Davis Middle School, and Salem High School.
Ownership History
Date
Name
Owned For
Owner Type
Purchase Details
Closed on
Apr 30, 2003
Sold by
Hardy Carol H
Bought by
Scrivens Pecola P
Current Estimated Value
Home Financials for this Owner
Home Financials are based on the most recent Mortgage that was taken out on this home.
Original Mortgage
$150,000
Outstanding Balance
$65,193
Interest Rate
5.79%
Mortgage Type
New Conventional
Estimated Equity
$259,700
Purchase Details
Closed on
Jun 29, 1998
Sold by
Smith Michael Lee and Smith Laura Ruth
Bought by
Raudebaugh Carol H
Home Financials for this Owner
Home Financials are based on the most recent Mortgage that was taken out on this home.
Original Mortgage
$124,900
Interest Rate
6.94%
Mortgage Type
New Conventional
Purchase Details
Closed on
Feb 28, 1996
Sold by
San Bud Bldrsinc
Bought by
Smith Michael Laura
Create a Home Valuation Report for This Property
The Home Valuation Report is an in-depth analysis detailing your home's value as well as a comparison with similar homes in the area
Home Values in the Area
Average Home Value in this Area
Purchase History
| Date | Buyer | Sale Price | Title Company |
|---|---|---|---|
| Scrivens Pecola P | $157,900 | -- | |
| Raudebaugh Carol H | $144,900 | -- | |
| Smith Michael Laura | $129,900 | -- |
Source: Public Records
Mortgage History
| Date | Status | Borrower | Loan Amount |
|---|---|---|---|
| Open | Scrivens Pecola P | $150,000 | |
| Previous Owner | Raudebaugh Carol H | $124,900 | |
| Closed | Smith Michael Laura | $0 |
Source: Public Records
Tax History Compared to Growth
Tax History
| Year | Tax Paid | Tax Assessment Tax Assessment Total Assessment is a certain percentage of the fair market value that is determined by local assessors to be the total taxable value of land and additions on the property. | Land | Improvement |
|---|---|---|---|---|
| 2024 | $2,606 | $134,440 | $25,360 | $109,080 |
| 2023 | $1,947 | $114,360 | $26,400 | $87,960 |
| 2022 | $1,848 | $98,240 | $22,640 | $75,600 |
| 2021 | $995 | $62,960 | $10,840 | $52,120 |
| 2020 | $964 | $62,960 | $10,840 | $52,120 |
| 2019 | $1,148 | $67,840 | $10,840 | $57,000 |
| 2018 | $1,045 | $64,280 | $9,680 | $54,600 |
| 2017 | $632 | $50,720 | $8,680 | $42,040 |
| 2016 | $545 | $50,720 | $8,680 | $42,040 |
| 2015 | $545 | $50,720 | $8,680 | $42,040 |
| 2014 | $425 | $50,428 | $8,000 | $42,428 |
| 2013 | -- | $56,920 | $12,000 | $44,920 |
Source: Public Records
Map
Nearby Homes
- 4797 Hemlock Dr SE
- 4811 W Lake Dr SE
- 510 Bell Rd SE Unit 1
- 4931 W Lake Dr SE
- 4938 Lake Forest Dr SE
- 4731 Shadybrook Way SE Unit 2
- 570 Bell Rd SE
- 495 Oglesby Bridge Rd SE
- 1459 Highway 212 SW
- 4970 Hull Rd SE
- 385 Oglesby Bridge Rd SE
- 4980 W Lake Dr SE
- 550 Oglesby Bridge Rd SE
- 801 Greenwood Trail SE
- 246 Bridgewood Dr SE
- 2178 NE Hillwood Dr
- 634 Knollwood Cir SE
- 1023 Plantation Ct SE
- 604 Hamlet Ct SE
- 4740 Habersham Way SE
- 4760 Habersham Way SE
- 457 Birch Ln SE
- 4730 Habersham Way SE Unit 3
- 4770 Habersham Way SE
- 447 Birch Ln SE
- 4751 Habersham Way SE Unit 3
- 4741 Habersham Way SE
- 4822 Hemlock Dr SE
- 4761 Habersham Way SE
- 4731 Habersham Way SE
- 437 Birch Ln SE
- 4720 Habersham Way SE
- 4780 Habersham Way SE Unit 3
- 4771 Habersham Way SE
- 4771 Habersham Way SE Unit 17
- 4721 Habersham Way SE
- 4820 Hemlock Dr SE
- 466 Birch Ln SE
- 4781 Habersham Way SE