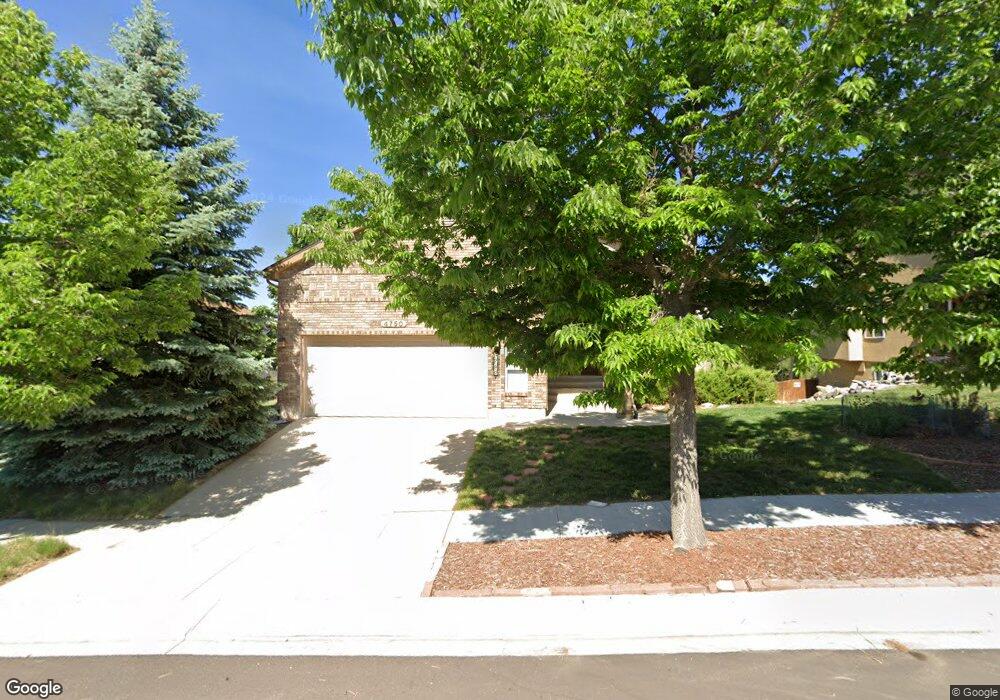
4750 Paramount Place Colorado Springs, CO 80918
Vista Grande NeighborhoodEstimated Value: $597,133 - $686,000
4
Beds
3
Baths
1,689
Sq Ft
$371/Sq Ft
Est. Value
About This Home
This home is located at 4750 Paramount Place, Colorado Springs, CO 80918 and is currently estimated at $626,783, approximately $371 per square foot. 4750 Paramount Place is a home located in El Paso County with nearby schools including Martinez Elementary School, Jenkins Middle School, and Doherty High School.
Ownership History
Date
Name
Owned For
Owner Type
Purchase Details
Closed on
Sep 18, 2023
Sold by
Leasure David E and Leasure Debbie E
Bought by
Leasure Living Trust
Current Estimated Value
Purchase Details
Closed on
Feb 13, 2020
Sold by
Glocker Carl L and Glocker Elsbeth W
Bought by
Leasure David E and Leasure Debbie E D
Home Financials for this Owner
Home Financials are based on the most recent Mortgage that was taken out on this home.
Original Mortgage
$333,675
Interest Rate
3.6%
Mortgage Type
New Conventional
Purchase Details
Closed on
Jul 16, 1999
Sold by
Allure Homes Ltd
Bought by
Glocker Carl L and Glocker Elsbeth W
Purchase Details
Closed on
Mar 25, 1999
Sold by
Caitbrand Llc
Bought by
Allure Homes Ltd
Purchase Details
Closed on
Feb 26, 1999
Sold by
Development Management Inc
Bought by
Caitbrand Llc
Create a Home Valuation Report for This Property
The Home Valuation Report is an in-depth analysis detailing your home's value as well as a comparison with similar homes in the area
Home Values in the Area
Average Home Value in this Area
Purchase History
| Date | Buyer | Sale Price | Title Company |
|---|---|---|---|
| Leasure Living Trust | -- | None Listed On Document | |
| Leasure David E | $443,900 | Empire Title Co Springs Llc | |
| Glocker Carl L | $262,300 | -- | |
| Allure Homes Ltd | -- | -- | |
| Caitbrand Llc | $59,400 | Stewart Title |
Source: Public Records
Mortgage History
| Date | Status | Borrower | Loan Amount |
|---|---|---|---|
| Previous Owner | Leasure David E | $333,675 |
Source: Public Records
Tax History Compared to Growth
Tax History
| Year | Tax Paid | Tax Assessment Tax Assessment Total Assessment is a certain percentage of the fair market value that is determined by local assessors to be the total taxable value of land and additions on the property. | Land | Improvement |
|---|---|---|---|---|
| 2025 | $2,243 | $41,980 | -- | -- |
| 2024 | $2,122 | $42,110 | $6,190 | $35,920 |
| 2023 | $2,122 | $42,110 | $6,190 | $35,920 |
| 2022 | $1,852 | $30,930 | $5,490 | $25,440 |
| 2021 | $2,003 | $31,830 | $5,650 | $26,180 |
| 2020 | $1,427 | $27,020 | $4,900 | $22,120 |
| 2019 | $1,420 | $27,020 | $4,900 | $22,120 |
| 2018 | $1,319 | $24,260 | $4,940 | $19,320 |
| 2017 | $1,253 | $24,260 | $4,940 | $19,320 |
| 2016 | $979 | $23,780 | $5,010 | $18,770 |
| 2015 | $976 | $23,780 | $5,010 | $18,770 |
| 2014 | $928 | $22,430 | $5,010 | $17,420 |
Source: Public Records
Map
Nearby Homes
- 5347 Wells Fargo Dr
- 5635 Altitude Dr
- 5210 Turquoise Dr
- 4740 Rustler Ct
- 5421 Copper Dr
- 0 Copper Dr Unit 2206120
- 5485 Castilian Villas Point
- 5747 Tradewind Point
- 6465 Whirlwind Dr
- 5978 Maroon Mesa Dr
- 5162 Sunset Ridge Dr
- 5739 Wells Fargo Dr E
- 5050 Copernicus Way
- 5105 Saddleback Heights
- 4735 Seton Place
- 6103 Treeledge Dr
- 6243 Fowler Mill Point
- 6256 Fowler Mill Point
- 4966 Galileo Dr
- 5745 Doe Skin Ct
- 4760 Paramount Place
- 4730 Paramount Place
- 5335 Roundup Dr
- 5345 Roundup Dr
- 5355 Roundup Dr
- 5325 Roundup Dr
- 4765 Paramount Place
- 4770 Paramount Place
- 4755 Paramount Place
- 4775 Paramount Place
- 4780 Paramount Place
- 5365 Roundup Dr
- 4785 Paramount Place
- 5330 Roundup Dr
- 5320 Roundup Dr
- 5340 Roundup Dr
- 4725 Paramount Place
- 4715 Paramount Place
- 5310 Roundup Dr
- 4705 Paramount Place