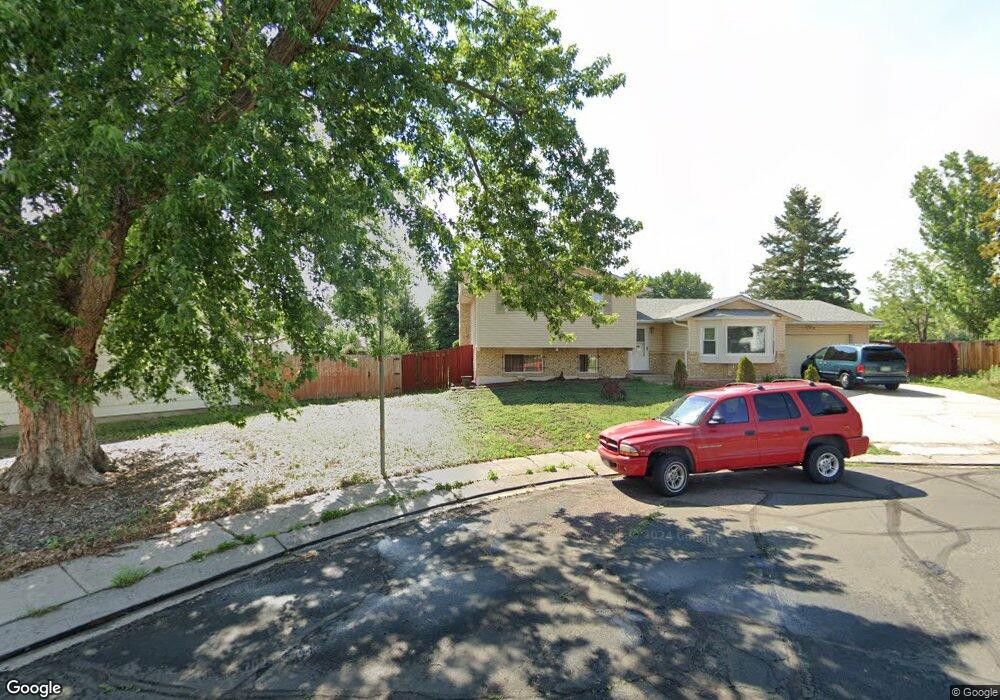
4750 Shadowglen Dr Colorado Springs, CO 80918
Garden Ranch NeighborhoodEstimated Value: $415,000 - $446,000
3
Beds
3
Baths
1,214
Sq Ft
$354/Sq Ft
Est. Value
About This Home
This home is located at 4750 Shadowglen Dr, Colorado Springs, CO 80918 and is currently estimated at $429,884, approximately $354 per square foot. 4750 Shadowglen Dr is a home located in El Paso County with nearby schools including Grant Elementary School, Mann Middle School, and Mitchell High School.
Ownership History
Date
Name
Owned For
Owner Type
Purchase Details
Closed on
Feb 4, 2022
Sold by
Rodriguez Armando A
Bought by
Rodriguez Ana V
Current Estimated Value
Purchase Details
Closed on
Jul 5, 2013
Sold by
Rodriguez Armando A and Rodriguez Jennifer J
Bought by
Rodriguez Ana
Purchase Details
Closed on
Oct 28, 2011
Sold by
Pierson Donna L
Bought by
Rodriguez Armando A and Rodriguez Jennifer J
Home Financials for this Owner
Home Financials are based on the most recent Mortgage that was taken out on this home.
Original Mortgage
$159,842
Interest Rate
4.14%
Mortgage Type
FHA
Purchase Details
Closed on
Aug 24, 1994
Sold by
Jarrell Gregory H and Jarrell Lori S
Bought by
Pierson Charles A and Pierson Donna L
Home Financials for this Owner
Home Financials are based on the most recent Mortgage that was taken out on this home.
Original Mortgage
$110,800
Interest Rate
8.69%
Mortgage Type
VA
Purchase Details
Closed on
Jul 7, 1989
Bought by
Rodriguez Ana V
Purchase Details
Closed on
Jun 1, 1979
Bought by
Rodriguez Ana V
Create a Home Valuation Report for This Property
The Home Valuation Report is an in-depth analysis detailing your home's value as well as a comparison with similar homes in the area
Home Values in the Area
Average Home Value in this Area
Purchase History
| Date | Buyer | Sale Price | Title Company |
|---|---|---|---|
| Rodriguez Ana V | -- | None Listed On Document | |
| Rodriguez Ana | -- | None Available | |
| Rodriguez Armando A | $164,000 | Heritage Title | |
| Pierson Charles A | $115,000 | -- | |
| Rodriguez Ana V | $75,000 | -- | |
| Rodriguez Ana V | -- | -- |
Source: Public Records
Mortgage History
| Date | Status | Borrower | Loan Amount |
|---|---|---|---|
| Previous Owner | Rodriguez Armando A | $159,842 | |
| Previous Owner | Pierson Charles A | $110,800 |
Source: Public Records
Tax History Compared to Growth
Tax History
| Year | Tax Paid | Tax Assessment Tax Assessment Total Assessment is a certain percentage of the fair market value that is determined by local assessors to be the total taxable value of land and additions on the property. | Land | Improvement |
|---|---|---|---|---|
| 2025 | $1,431 | $31,080 | -- | -- |
| 2024 | $1,317 | $30,170 | $4,820 | $25,350 |
| 2022 | $1,238 | $22,130 | $3,610 | $18,520 |
| 2021 | $1,344 | $22,770 | $3,720 | $19,050 |
| 2020 | $1,267 | $18,660 | $3,220 | $15,440 |
| 2019 | $1,260 | $18,660 | $3,220 | $15,440 |
| 2018 | $1,060 | $14,450 | $2,160 | $12,290 |
| 2017 | $1,004 | $14,450 | $2,160 | $12,290 |
| 2016 | $821 | $14,170 | $2,230 | $11,940 |
| 2015 | $818 | $14,170 | $2,230 | $11,940 |
| 2014 | $768 | $12,760 | $2,230 | $10,530 |
Source: Public Records
Map
Nearby Homes
- 3710 Windflower Cir
- 3709 Anemone Cir
- 4410 Moonlight Dr
- 4518 Misty Dr
- 3704 Indianpipe Cir
- 3716 Indianpipe Cir
- 4434 Misty Dr
- 4742 Villa Cir Unit A
- 4853 Sonata Dr Unit C
- 3633 Indianpipe Cir
- 4858 Sonata Dr Unit D
- 4534 Bella Dr
- 4806 Sprucewood Dr
- 4886 Sonata Dr Unit C
- 3710 Mesa Grande Dr
- 4519 Bella Dr
- 4526 Del Verde Dr
- 4454 Ranch Cir
- 4906 Hackamore Dr S
- 4380 Saddlewood Dr
- 4754 Shadowglen Dr
- 4748 Shadowglen Dr
- 4723 Misty Dr
- 4725 Misty Dr
- 4760 Shadowglen Dr
- 3207 Misty Place
- 3211 Misty Place
- 4744 Shadowglen Dr
- 4719 Misty Dr
- 4727 Misty Dr
- 4768 Shadowglen Dr
- 4715 Misty Dr
- 4753 Shadowglen Dr
- 3215 Misty Place
- 4757 Shadowglen Dr
- 4749 Shadowglen Dr
- 4776 Shadowglen Dr
- 4736 Shadowglen Dr
- 4761 Shadowglen Dr
- 4745 Shadowglen Dr