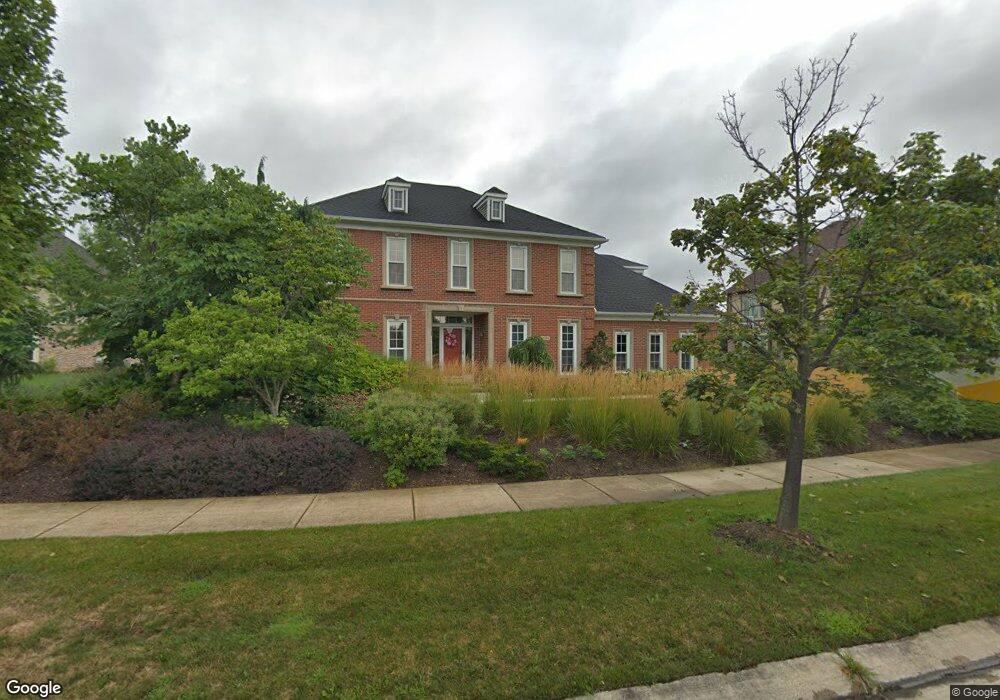
47500 Putney Ct Unit Bldg-Unit Canton, MI 48188
Estimated Value: $631,000 - $732,000
Studio
5
Baths
3,137
Sq Ft
$222/Sq Ft
Est. Value
About This Home
This home is located at 47500 Putney Ct Unit Bldg-Unit, Canton, MI 48188 and is currently estimated at $697,400, approximately $222 per square foot. 47500 Putney Ct Unit Bldg-Unit is a home located in Wayne County with nearby schools including Canton High School, Plymouth High School, and Salem High School.
Ownership History
Date
Name
Owned For
Owner Type
Purchase Details
Closed on
Dec 17, 2021
Sold by
Tharp Jacob K and Tharp Angelique J
Bought by
Gage Danielle
Current Estimated Value
Home Financials for this Owner
Home Financials are based on the most recent Mortgage that was taken out on this home.
Original Mortgage
$570,000
Outstanding Balance
$519,920
Interest Rate
3.11%
Mortgage Type
New Conventional
Estimated Equity
$177,480
Purchase Details
Closed on
Jul 31, 2018
Sold by
Allam Dominic
Bought by
Tharp Jacob K and Tharp Angelique J
Purchase Details
Closed on
Oct 2, 2010
Sold by
Allam Dominic and Allam Jennifer M
Bought by
Allam Dominic and Allam Jennifer
Home Financials for this Owner
Home Financials are based on the most recent Mortgage that was taken out on this home.
Original Mortgage
$264,000
Interest Rate
3.75%
Mortgage Type
New Conventional
Purchase Details
Closed on
Jun 8, 2007
Sold by
Allam Dominic J and Allam Jennifer M
Bought by
Allam Dominic
Purchase Details
Closed on
Apr 23, 2001
Sold by
Main St Homes Inc
Bought by
Allam Dominic J
Purchase Details
Closed on
Oct 1, 1999
Sold by
Fairway West Assoc
Bought by
Main St Homes Inc
Create a Home Valuation Report for This Property
The Home Valuation Report is an in-depth analysis detailing your home's value as well as a comparison with similar homes in the area
Home Values in the Area
Average Home Value in this Area
Purchase History
| Date | Buyer | Sale Price | Title Company |
|---|---|---|---|
| Gage Danielle | $606,000 | None Listed On Document | |
| Tharp Jacob K | $495,000 | Devon Title Co | |
| Allam Dominic | -- | None Available | |
| Allam Dominic | -- | None Available | |
| Allam Dominic J | $395,000 | -- | |
| Main St Homes Inc | $75,000 | -- |
Source: Public Records
Mortgage History
| Date | Status | Borrower | Loan Amount |
|---|---|---|---|
| Open | Gage Danielle | $570,000 | |
| Previous Owner | Allam Dominic | $264,000 |
Source: Public Records
Tax History
| Year | Tax Paid | Tax Assessment Tax Assessment Total Assessment is a certain percentage of the fair market value that is determined by local assessors to be the total taxable value of land and additions on the property. | Land | Improvement |
|---|---|---|---|---|
| 2025 | $4,704 | $321,600 | $0 | $0 |
| 2024 | $4,570 | $291,900 | $0 | $0 |
| 2023 | $4,357 | $252,100 | $0 | $0 |
| 2022 | $9,359 | $229,800 | $0 | $0 |
| 2021 | $8,968 | $221,900 | $0 | $0 |
| 2020 | $8,862 | $218,200 | $0 | $0 |
| 2019 | $8,698 | $212,550 | $0 | $0 |
| 2018 | $3,175 | $212,720 | $0 | $0 |
| 2017 | $7,604 | $197,900 | $0 | $0 |
| 2016 | $6,874 | $205,000 | $0 | $0 |
| 2015 | $17,443 | $195,940 | $0 | $0 |
| 2013 | $16,898 | $183,900 | $0 | $0 |
| 2010 | -- | $163,800 | $74,961 | $88,839 |
Source: Public Records
Map
Nearby Homes
- 51083 Meadowlands
- 46985 Glastonbury Dr
- 1845 Scenic Dr Unit 124
- 392 Lenox Dr
- 379 Springfield Dr
- 241 Country Club Ln
- 48030 Cherry Hill Rd
- 2832 Wakefield Dr
- 137 Village Way
- 1752 Thistle Dr
- 1849 Wentworth Ct
- 47450 Ellery Ln
- 46501 Killarney Cir
- 0000 Denton Rd
- 00000 Denton Rd
- 48893 Fifth Ave
- 1039 Truman Dr
- 897 Harrison St
- 345 Canton Center Rd
- 3410 Niagara Ave
- 47500 Putney Ct
- 47484 Putney Ct Unit Bldg-Unit
- 47484 Putney Ct
- 47532 Putney Ct
- 47483 Ashford Dr S
- 47485 Putney Ct
- 47501 Putney Ct Unit Bldg-Unit
- 47501 Putney Ct
- 47468 Putney Ct
- 47517 Putney Ct
- 47467 Wallingford Ct
- 47531 Ashford Dr S
- 47469 Putney Ct Unit Bldg-Unit
- 47469 Putney Ct
- 47452 Putney Ct
- 47498 Ashford Dr S
- 572 Delaford Dr
- 47514 Ashford Dr S
- 47453 Putney Ct
- 47547 Ashford Dr S
Your Personal Tour Guide
Ask me questions while you tour the home.