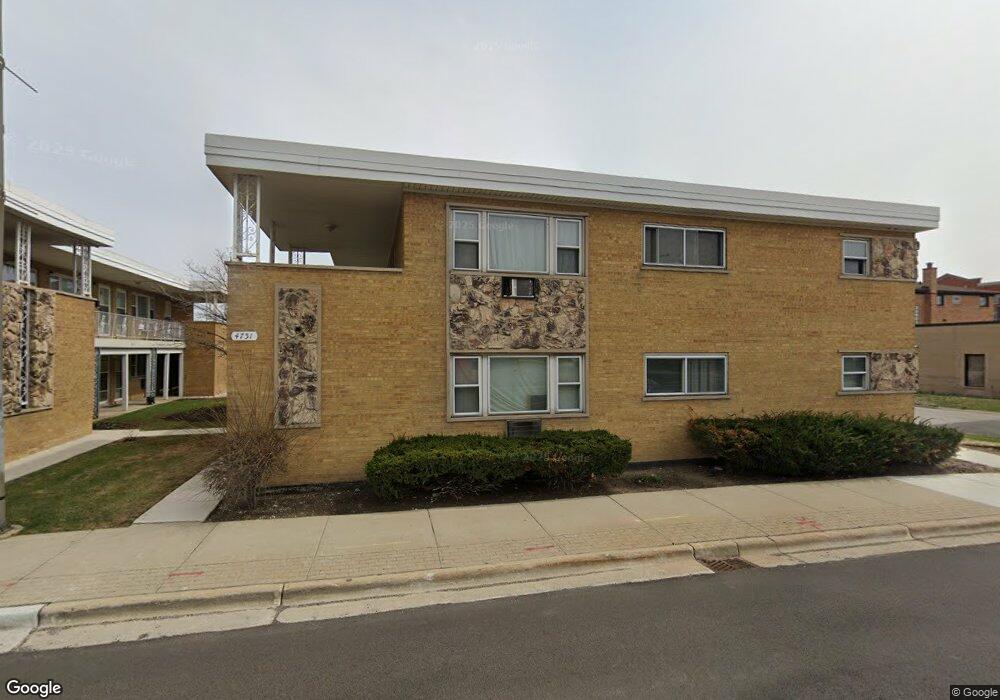
4751 25th Ave Unit 47511 Schiller Park, IL 60176
Estimated Value: $103,000 - $123,546
1
Bed
--
Bath
641
Sq Ft
$174/Sq Ft
Est. Value
About This Home
This home is located at 4751 25th Ave Unit 47511, Schiller Park, IL 60176 and is currently estimated at $111,387, approximately $173 per square foot. 4751 25th Ave Unit 47511 is a home located in Cook County with nearby schools including John F Kennedy Elementary School, Washington Elementary School, and Lincoln Middle School.
Ownership History
Date
Name
Owned For
Owner Type
Purchase Details
Closed on
Mar 13, 2025
Sold by
Gula Zbigniew Krzysztof
Bought by
Hasku Zehajdin
Current Estimated Value
Purchase Details
Closed on
Jun 3, 2016
Sold by
Arellano Ildelisa
Bought by
Gula Zbigniew Krzysztof
Purchase Details
Closed on
Oct 26, 2015
Sold by
Todorov Viktor G
Bought by
Arellano Ildelisa
Purchase Details
Closed on
Jul 12, 2013
Sold by
Pnc Bank Na
Bought by
Todorov Viktor G
Purchase Details
Closed on
Nov 15, 2012
Sold by
Jaszczolt Andrew
Bought by
Pnc Bank Na
Purchase Details
Closed on
May 19, 2005
Sold by
W & M Condominiums Inc
Bought by
Jaszczolt Andrew
Home Financials for this Owner
Home Financials are based on the most recent Mortgage that was taken out on this home.
Original Mortgage
$72,000
Interest Rate
5.25%
Mortgage Type
Fannie Mae Freddie Mac
Create a Home Valuation Report for This Property
The Home Valuation Report is an in-depth analysis detailing your home's value as well as a comparison with similar homes in the area
Home Values in the Area
Average Home Value in this Area
Purchase History
| Date | Buyer | Sale Price | Title Company |
|---|---|---|---|
| Hasku Zehajdin | $108,000 | Fidelity National Title | |
| Gula Zbigniew Krzysztof | $60,000 | Attorneys Title Guaranty Fun | |
| Arellano Ildelisa | -- | Affinity Title Services Llc | |
| Todorov Viktor G | $40,000 | Premier Title | |
| Pnc Bank Na | -- | None Available | |
| Jaszczolt Andrew | $90,000 | Atg Search |
Source: Public Records
Mortgage History
| Date | Status | Borrower | Loan Amount |
|---|---|---|---|
| Previous Owner | Jaszczolt Andrew | $72,000 |
Source: Public Records
Tax History Compared to Growth
Tax History
| Year | Tax Paid | Tax Assessment Tax Assessment Total Assessment is a certain percentage of the fair market value that is determined by local assessors to be the total taxable value of land and additions on the property. | Land | Improvement |
|---|---|---|---|---|
| 2024 | $2,475 | $7,688 | $640 | $7,048 |
| 2023 | $2,474 | $7,688 | $640 | $7,048 |
| 2022 | $2,474 | $7,688 | $640 | $7,048 |
| 2021 | $2,268 | $5,916 | $461 | $5,455 |
| 2020 | $2,172 | $5,916 | $461 | $5,455 |
| 2019 | $2,102 | $6,672 | $461 | $6,211 |
| 2018 | $1,391 | $3,897 | $390 | $3,507 |
| 2017 | $1,388 | $3,897 | $390 | $3,507 |
| 2016 | $1,305 | $3,897 | $390 | $3,507 |
| 2015 | $2,536 | $7,106 | $355 | $6,751 |
| 2014 | $3,247 | $9,169 | $355 | $8,814 |
| 2013 | $3,285 | $9,613 | $355 | $9,258 |
Source: Public Records
Map
Nearby Homes
- 4816 Michigan Ave
- 9740 Linn Ave
- 9945 Sunnyside Ave
- 5010 Harold Ave
- 9514 Lawrence Ave Unit 2105
- 9514 Lawrence Ave Unit 2106
- 9514 Lawrence Ave Unit 2204
- 9858 Montrose Ave
- 4608 Wesley Terrace
- 4348 Ruby St
- 5047 Forster Ave
- 4305 Judd Ave
- 4438 Wesley Terrace
- 9912 Irving Park Rd
- 4228 Atlantic Ave
- 4012 Wagner Ave
- 4008 Wagner Ave
- 9355 Irving Park Rd Unit 522
- 4034 Denley Ave
- 9231 W Irving Park Rd
- 4751 25th Ave Unit 475110
- 4751 25th Ave Unit 47517
- 4751 25th Ave Unit 47515
- 4751 25th Ave Unit 47513
- 4751 25th Ave Unit 47512
- 4751 25th Ave Unit 47516
- 4751 25th Ave Unit 47518
- 4751 25th Ave Unit 47519
- 4751 25th Ave Unit 47514
- 4751 25th Ave Unit 4
- 4751 25th Ave Unit 6
- 4751 25th Ave Unit 8
- 4751 25th Ave Unit 5
- 4751 25th Ave Unit 7
- 4751 25th Ave Unit 3
- 4753 25th Ave Unit 475320
- 4753 25th Ave Unit 475315
- 4753 25th Ave Unit 475314
- 4753 25th Ave Unit 475319
- 4753 25th Ave Unit 475317