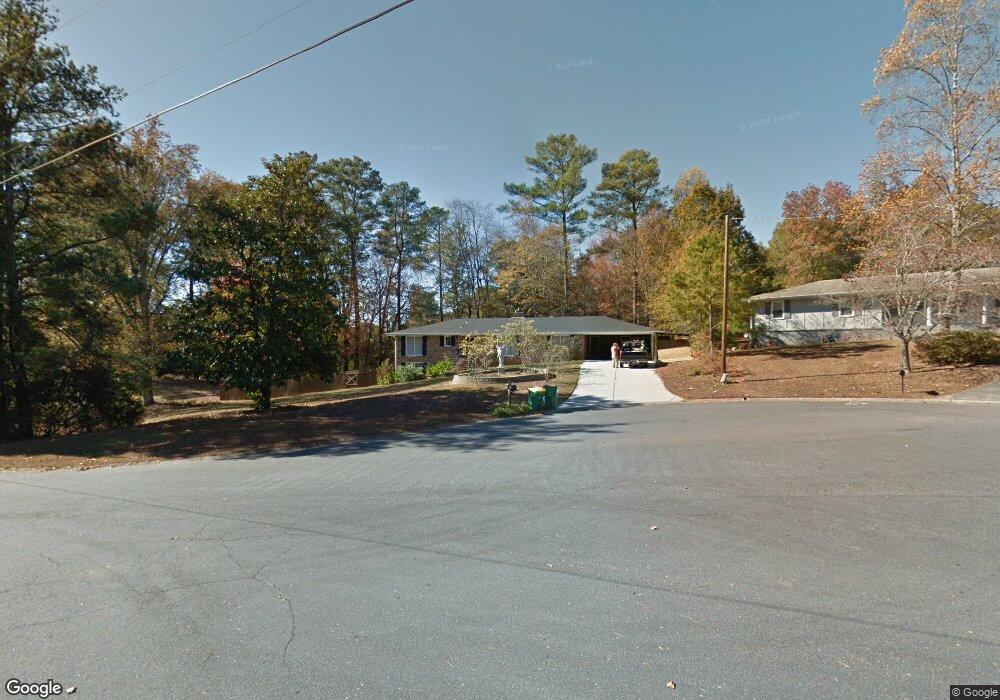
4751 York Place NE Unit 3 Roswell, GA 30075
Sandy Plains NeighborhoodEstimated Value: $382,000 - $454,000
3
Beds
2
Baths
1,890
Sq Ft
$220/Sq Ft
Est. Value
About This Home
This home is located at 4751 York Place NE Unit 3, Roswell, GA 30075 and is currently estimated at $414,898, approximately $219 per square foot. 4751 York Place NE Unit 3 is a home located in Cobb County with nearby schools including Garrison Mill Elementary School, Mabry Middle School, and Lassiter High School.
Ownership History
Date
Name
Owned For
Owner Type
Purchase Details
Closed on
Nov 17, 2011
Sold by
Horton Brookes E
Bought by
Mcgee Shawn M
Current Estimated Value
Home Financials for this Owner
Home Financials are based on the most recent Mortgage that was taken out on this home.
Original Mortgage
$151,325
Outstanding Balance
$103,557
Interest Rate
4.17%
Mortgage Type
VA
Estimated Equity
$311,341
Purchase Details
Closed on
May 18, 2009
Sold by
Horton Thomas H
Bought by
Horton Brookes E
Purchase Details
Closed on
May 18, 2004
Sold by
Ryan John C
Bought by
Horton Brookes E and Horton Brooks
Home Financials for this Owner
Home Financials are based on the most recent Mortgage that was taken out on this home.
Original Mortgage
$149,150
Interest Rate
7%
Mortgage Type
New Conventional
Create a Home Valuation Report for This Property
The Home Valuation Report is an in-depth analysis detailing your home's value as well as a comparison with similar homes in the area
Home Values in the Area
Average Home Value in this Area
Purchase History
| Date | Buyer | Sale Price | Title Company |
|---|---|---|---|
| Mcgee Shawn M | $150,000 | -- | |
| Horton Brookes E | -- | -- | |
| Horton Brookes E | $1,000 | -- | |
| Horton Thomas H | $157,000 | -- |
Source: Public Records
Mortgage History
| Date | Status | Borrower | Loan Amount |
|---|---|---|---|
| Open | Mcgee Shawn M | $151,325 | |
| Previous Owner | Horton Thomas H | $149,150 |
Source: Public Records
Tax History Compared to Growth
Tax History
| Year | Tax Paid | Tax Assessment Tax Assessment Total Assessment is a certain percentage of the fair market value that is determined by local assessors to be the total taxable value of land and additions on the property. | Land | Improvement |
|---|---|---|---|---|
| 2025 | $3,732 | $161,556 | $32,000 | $129,556 |
| 2024 | $3,036 | $129,344 | $24,000 | $105,344 |
| 2023 | $2,494 | $129,344 | $24,000 | $105,344 |
| 2022 | $3,060 | $129,344 | $24,000 | $105,344 |
| 2021 | $2,675 | $111,768 | $20,000 | $91,768 |
| 2020 | $2,675 | $111,768 | $20,000 | $91,768 |
| 2019 | $2,028 | $82,188 | $20,000 | $62,188 |
| 2018 | $2,028 | $82,188 | $20,000 | $62,188 |
| 2017 | $1,982 | $83,560 | $20,000 | $63,560 |
| 2016 | $1,714 | $71,268 | $20,000 | $51,268 |
| 2015 | $1,755 | $71,268 | $20,000 | $51,268 |
| 2014 | $1,502 | $59,384 | $0 | $0 |
Source: Public Records
Map
Nearby Homes
- 11675 Highland Colony Dr Unit 1
- 11790 Highland Colony Dr
- 11775 Highland Colony Dr Unit 1
- 4383 Capstone Ct NE
- 2000 Trotters Ridge Way Unit 2B
- 4973 Gunners Pass NE
- 1820 Azalea Springs Trail
- 4304 Lindsey Way NE
- 105 Beech Tree Ln
- 4363 Old Mabry Rd NE
- 4361 Old Mabry Ln NE
- 4765 Catoosa Trail NE Unit 2
- 230 Moss Stone Way Unit 2
- 11395 West Rd
- 1945 Ledieu Rd
- 715 Winterwind Way
- 235 Foxley Way
- 4673 Jefferson Township Place
- 4763 York Place NE
- 4731 York Place NE Unit 3
- 4695 Surrey Rd Unit 2
- 4705 Surrey Rd
- 4750 York Place NE
- 4740 York Place NE
- 4685 Surrey Rd
- 4715 Surrey Rd
- 4770 York Place NE
- 4760 York Place NE
- 4730 York Place NE Unit 3
- 4730 York Place NE
- 4725 Surrey Rd
- 0 Surrey Rd Unit 7128234
- 0 Surrey Rd Unit 3067254
- 4720 York Place NE
- 4720 York Place NE
- 4720 York Place NE
- 160 Laurel Branch Ct
- 150 Laurel Branch Ct