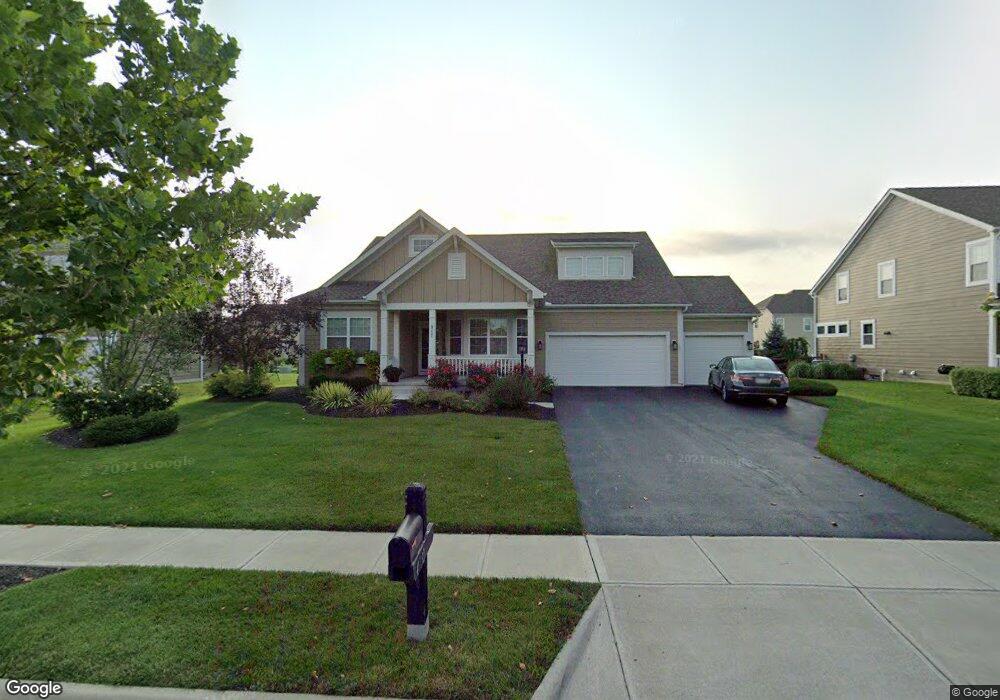
4752 Braiden Dr Galena, OH 43021
Estimated Value: $620,454 - $750,000
3
Beds
3
Baths
2,514
Sq Ft
$271/Sq Ft
Est. Value
About This Home
This home is located at 4752 Braiden Dr, Galena, OH 43021 and is currently estimated at $680,364, approximately $270 per square foot. 4752 Braiden Dr is a home with nearby schools including Johnnycake Corners Elementary School, Berkshire Middle School, and Olentangy Berlin High School.
Ownership History
Date
Name
Owned For
Owner Type
Purchase Details
Closed on
Aug 3, 2020
Sold by
Hall Steven D
Bought by
Hall Steven D and Hall Katherine Karpowicz
Current Estimated Value
Home Financials for this Owner
Home Financials are based on the most recent Mortgage that was taken out on this home.
Original Mortgage
$312,150
Outstanding Balance
$249,579
Interest Rate
3%
Mortgage Type
New Conventional
Estimated Equity
$430,785
Purchase Details
Closed on
Dec 18, 2013
Sold by
Mi Homes Of Central Ohio Llc
Bought by
Hall Steven D
Home Financials for this Owner
Home Financials are based on the most recent Mortgage that was taken out on this home.
Original Mortgage
$351,850
Interest Rate
4.5%
Mortgage Type
New Conventional
Purchase Details
Closed on
Nov 29, 2012
Sold by
M I Homes Of Cincinnati Llc
Bought by
M I Homes Of Central Ohio Llc
Create a Home Valuation Report for This Property
The Home Valuation Report is an in-depth analysis detailing your home's value as well as a comparison with similar homes in the area
Home Values in the Area
Average Home Value in this Area
Purchase History
| Date | Buyer | Sale Price | Title Company |
|---|---|---|---|
| Hall Steven D | -- | Northwest Ttl Fam Companies | |
| Hall Steven D | $372,000 | Transohio Title Agency | |
| M I Homes Of Central Ohio Llc | -- | Transohio Residential Title |
Source: Public Records
Mortgage History
| Date | Status | Borrower | Loan Amount |
|---|---|---|---|
| Open | Hall Steven D | $312,150 | |
| Closed | Hall Steven D | $351,850 |
Source: Public Records
Tax History
| Year | Tax Paid | Tax Assessment Tax Assessment Total Assessment is a certain percentage of the fair market value that is determined by local assessors to be the total taxable value of land and additions on the property. | Land | Improvement |
|---|---|---|---|---|
| 2024 | $10,490 | $180,820 | $39,030 | $141,790 |
| 2023 | $10,447 | $180,820 | $39,030 | $141,790 |
| 2022 | $9,865 | $134,960 | $28,000 | $106,960 |
| 2021 | $9,925 | $134,960 | $28,000 | $106,960 |
| 2020 | $9,844 | $134,960 | $28,000 | $106,960 |
| 2019 | $9,177 | $129,850 | $28,000 | $101,850 |
| 2018 | $9,087 | $129,850 | $28,000 | $101,850 |
| 2017 | $8,559 | $122,510 | $22,090 | $100,420 |
| 2016 | $9,033 | $122,510 | $22,090 | $100,420 |
| 2015 | $8,225 | $122,510 | $22,090 | $100,420 |
| 2014 | $7,569 | $110,890 | $22,090 | $88,800 |
| 2013 | $1,378 | $19,880 | $19,880 | $0 |
Source: Public Records
Map
Nearby Homes
- 5632 Edgebrook Dr
- 5714 Braymoore Dr
- 6677 Via Florenza Dr
- 5505 Holiston Ct
- 6059 Victory Ln
- 6024 Victory Ln
- 6398 Garden Loop
- 6206 Garden Loop
- 6192 Garden Loop
- 5349 Slater Ridge Unit 5349
- 5217 Sierra Dr
- 7380 Lewis Center Rd
- 5173 Tralee Ln
- 4827 Saint Medan Dr
- 5395 Anacala Ct
- 4790 Sanctuary Dr
- 4527 McAlister Park Dr
- 5532 Meadowood Ln
- 5287 Genoa Farms Blvd
- 4772 S Old 3c Hwy
- 4736 Braiden Dr
- 4768 Braiden Dr
- 4724 Braiden Dr
- 6175 Fox Hollow Dr Unit 7602
- 4743 Braiden Dr Unit 7593
- 4776 Braiden Dr
- 6193 Fox Hollow Dr
- 4761 Braiden Dr
- 4735 Braiden Dr
- 6155 Fox Hollow Dr Unit 7601
- 4706 Braiden Dr
- 4782 Braiden Dr Unit 7583
- 6211 Fox Hollow Dr
- 6227 Fox Hollow Dr Unit 7605
- 6227 Fox Hollow Dr
- 4719 Braiden Dr
- 6137 Fox Hollow Dr
- 4796 Braiden Dr
- 4877 Braiden Dr
- 4697 Braiden Dr
Your Personal Tour Guide
Ask me questions while you tour the home.