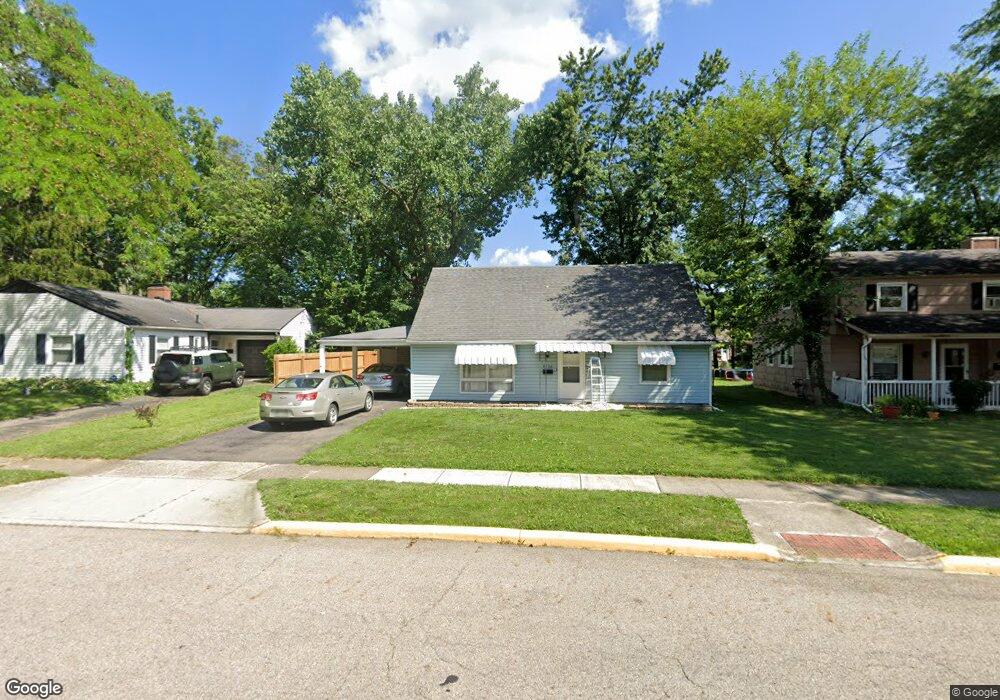
4752 Musket Way Columbus, OH 43228
Estimated Value: $206,408 - $234,000
3
Beds
1
Bath
1,427
Sq Ft
$153/Sq Ft
Est. Value
About This Home
This home is located at 4752 Musket Way, Columbus, OH 43228 and is currently estimated at $218,852, approximately $153 per square foot. 4752 Musket Way is a home located in Franklin County with nearby schools including Prairie Lincoln Elementary School, Galloway Ridge Intermediate School, and Norton Middle School.
Ownership History
Date
Name
Owned For
Owner Type
Purchase Details
Closed on
Aug 14, 2019
Sold by
Clark Richard A
Bought by
Byerly Andrew T and Watson Joshua N
Current Estimated Value
Home Financials for this Owner
Home Financials are based on the most recent Mortgage that was taken out on this home.
Original Mortgage
$135,800
Outstanding Balance
$118,936
Interest Rate
3.7%
Mortgage Type
New Conventional
Estimated Equity
$99,916
Purchase Details
Closed on
Dec 3, 2007
Sold by
Hud
Bought by
Clark Richard A
Purchase Details
Closed on
Dec 6, 2006
Sold by
Johnson Scott D and Us Bank Na
Bought by
Hud
Purchase Details
Closed on
Jun 10, 2003
Sold by
Phillips Kimberly E
Bought by
Johnson Scott D
Home Financials for this Owner
Home Financials are based on the most recent Mortgage that was taken out on this home.
Original Mortgage
$101,200
Interest Rate
5.51%
Mortgage Type
FHA
Purchase Details
Closed on
Feb 5, 1992
Bought by
Phillips Kimberly E
Create a Home Valuation Report for This Property
The Home Valuation Report is an in-depth analysis detailing your home's value as well as a comparison with similar homes in the area
Home Values in the Area
Average Home Value in this Area
Purchase History
| Date | Buyer | Sale Price | Title Company |
|---|---|---|---|
| Byerly Andrew T | $140,000 | None Available | |
| Clark Richard A | $60,051 | None Available | |
| Hud | $76,000 | None Available | |
| Johnson Scott D | $102,000 | Title First Agency Inc | |
| Phillips Kimberly E | $68,900 | -- |
Source: Public Records
Mortgage History
| Date | Status | Borrower | Loan Amount |
|---|---|---|---|
| Open | Byerly Andrew T | $135,800 | |
| Previous Owner | Johnson Scott D | $101,200 |
Source: Public Records
Tax History Compared to Growth
Tax History
| Year | Tax Paid | Tax Assessment Tax Assessment Total Assessment is a certain percentage of the fair market value that is determined by local assessors to be the total taxable value of land and additions on the property. | Land | Improvement |
|---|---|---|---|---|
| 2024 | $2,686 | $58,840 | $18,060 | $40,780 |
| 2023 | $2,572 | $58,835 | $18,060 | $40,775 |
| 2022 | $1,929 | $30,810 | $4,100 | $26,710 |
| 2021 | $1,959 | $30,810 | $4,100 | $26,710 |
| 2020 | $1,905 | $30,810 | $4,100 | $26,710 |
| 2019 | $1,959 | $26,990 | $3,400 | $23,590 |
| 2018 | $1,022 | $26,990 | $3,400 | $23,590 |
| 2017 | $1,852 | $26,990 | $3,400 | $23,590 |
| 2016 | $1,969 | $25,730 | $6,650 | $19,080 |
| 2015 | $985 | $25,730 | $6,650 | $19,080 |
| 2014 | $1,935 | $25,730 | $6,650 | $19,080 |
| 2013 | $1,139 | $30,275 | $7,840 | $22,435 |
Source: Public Records
Map
Nearby Homes
- 399 Carilla Ln
- 141 Beacon Run W Unit 26E
- 127 Tarryton Ct W Unit 23D
- 4714 Tarryton Ct S Unit 20-3F
- 4696 Tarryton Ct S Unit 7-3G
- 106 Tarryton Ct E Unit 8C
- 74 Tarryton Ct E Unit 10A
- 106 N Grener Ave
- 450 Lawrence Ave
- 430 Lawrence Ave
- 139 Garden Heights Ave
- 183 Buena Vista Ave
- 264 Lawrence Ave
- 105 Redmond Rd
- 0 Smith Rd Unit 225035308
- 144 Woodlawn Ave
- 135 Fernhill Ave
- 4657 Arnold Ave
- 4736 Palmetto St
- 142 Postle Blvd
- 4744 Musket Way
- 4760 Musket Way
- 4736 Musket Way
- 4749 Annhurst Rd
- 4768 Musket Way
- 4755 Annhurst Rd
- 4741 Annhurst Rd
- 4765 Annhurst Rd
- 4733 Annhurst Rd
- 4728 Musket Way
- 4779 Musket Way
- 4785 Musket Way
- 4776 Musket Way
- 4775 Annhurst Rd
- 4725 Annhurst Rd
- 4720 Musket Way
- 424 Revere Ct
- 4783 Annhurst Rd
- 4727 Musket Way
- 4793 Musket Way