4753 Shaunee Creek Dr Unit 26 Dayton, OH 45415
Estimated Value: $44,000 - $52,000
2
Beds
2
Baths
1,224
Sq Ft
$39/Sq Ft
Est. Value
About This Home
This home is located at 4753 Shaunee Creek Dr Unit 26, Dayton, OH 45415 and is currently estimated at $47,343, approximately $38 per square foot. 4753 Shaunee Creek Dr Unit 26 is a home located in Montgomery County with nearby schools including Valerie Elementary School, North Dayton School of Science & Discovery, and Horizon Science Academy-Dayton Elementary School.
Ownership History
Date
Name
Owned For
Owner Type
Purchase Details
Closed on
Dec 8, 2008
Sold by
Secretary Of Housing & Urban Development
Bought by
Conner Martha and Gee William
Current Estimated Value
Home Financials for this Owner
Home Financials are based on the most recent Mortgage that was taken out on this home.
Original Mortgage
$26,862
Outstanding Balance
$17,801
Interest Rate
6.19%
Mortgage Type
FHA
Estimated Equity
$29,542
Purchase Details
Closed on
Jan 7, 2008
Sold by
Matthews Kyna R
Bought by
Hud
Purchase Details
Closed on
Aug 3, 2001
Sold by
Vladimer Futoryansky and Futoryansky Vladimir
Bought by
Matthews Kyna R
Home Financials for this Owner
Home Financials are based on the most recent Mortgage that was taken out on this home.
Original Mortgage
$52,325
Interest Rate
7.15%
Mortgage Type
FHA
Create a Home Valuation Report for This Property
The Home Valuation Report is an in-depth analysis detailing your home's value as well as a comparison with similar homes in the area
Home Values in the Area
Average Home Value in this Area
Purchase History
| Date | Buyer | Sale Price | Title Company |
|---|---|---|---|
| Conner Martha | $26,500 | None Available | |
| Hud | $67,523 | None Available | |
| Matthews Kyna R | $53,900 | -- |
Source: Public Records
Mortgage History
| Date | Status | Borrower | Loan Amount |
|---|---|---|---|
| Open | Conner Martha | $26,862 | |
| Previous Owner | Matthews Kyna R | $52,325 |
Source: Public Records
Tax History Compared to Growth
Tax History
| Year | Tax Paid | Tax Assessment Tax Assessment Total Assessment is a certain percentage of the fair market value that is determined by local assessors to be the total taxable value of land and additions on the property. | Land | Improvement |
|---|---|---|---|---|
| 2024 | $1,296 | $17,730 | $3,890 | $13,840 |
| 2023 | $1,296 | $17,730 | $3,890 | $13,840 |
| 2022 | $1,270 | $12,760 | $2,800 | $9,960 |
| 2021 | $1,265 | $12,760 | $2,800 | $9,960 |
| 2020 | $1,265 | $12,760 | $2,800 | $9,960 |
| 2019 | $984 | $8,880 | $1,400 | $7,480 |
| 2018 | $985 | $8,880 | $1,400 | $7,480 |
| 2017 | $980 | $8,880 | $1,400 | $7,480 |
| 2016 | $1,200 | $10,640 | $1,400 | $9,240 |
| 2015 | $1,046 | $10,640 | $1,400 | $9,240 |
| 2014 | $1,046 | $10,640 | $1,400 | $9,240 |
| 2012 | -- | $16,020 | $5,600 | $10,420 |
Source: Public Records
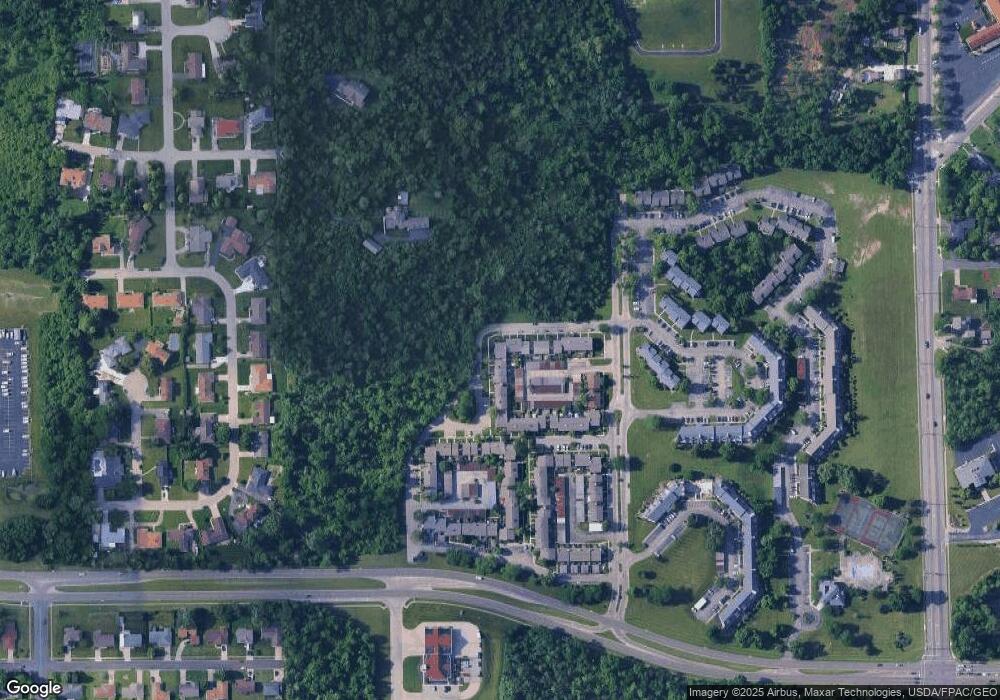
Map
Nearby Homes
- 4763 Shaunee Creek Dr Unit 31
- 4743 Shaunee Creek Dr Unit 21
- 4535 Lansmore Dr Unit 97
- 4601 Merrick Dr Unit 79
- 4624 Fayette Ct
- 3501 Piedmont Ave
- 4174 Meadowdale Dr
- 4130 Fleetwood Dr
- 5308 N Main St
- 5653 Philadelphia Dr
- 4321 Saylor St
- 0 Haney Rd E Unit 937713
- 158 Loretta Dr
- 111 Folsom Dr
- 266 Briarcliff Rd
- 209 Julia Ave
- 316 Park End Dr
- 4431 Wolf Rd
- 488 Eastdale Dr
- 473 Blueridge Dr
- 4753 Shaunee Creek Dr
- 4753 Shaunee Creek Dr Unit 25
- 4755 Shaunee Creek Dr Unit 27
- 4749 Shaunee Creek Dr Unit 2424
- 4749 Shaunee Creek Dr Unit 24
- 4757 Shaunee Creek Dr Unit 28
- 4747 Shaunee Creek Dr Unit 23
- 4759 Shaunee Creek Dr Unit 29
- 4745 Shaunee Creek Dr Unit 22
- 4761 Shaunee Creek Dr Unit 30
- 4765 Shaunee Creek Dr Unit 32
- 4741 Shaunee Creek Dr Unit 20
- 4767 Shaunee Creek Dr Unit 33
- 4737 Shaunee Creek Dr Unit 18
- 4737 Shaunee Creek Dr Unit 17
- 4737 Shaunee Creek Dr
- 4737 Shaunee Creek Dr
- 4769 Shaunee Creek Dr Unit 34
- 4635 Merrick Dr Unit 16
- 4637 Merrick Dr Unit 15