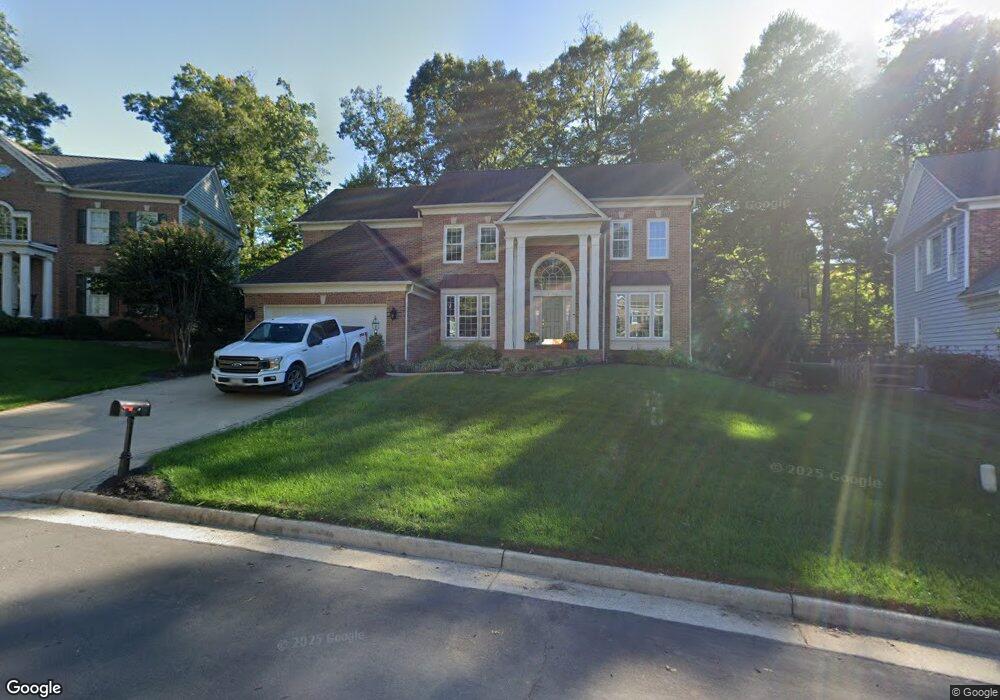
47532 Compton Cir Sterling, VA 20165
Estimated Value: $1,014,465 - $1,123,000
4
Beds
5
Baths
3,108
Sq Ft
$343/Sq Ft
Est. Value
About This Home
This home is located at 47532 Compton Cir, Sterling, VA 20165 and is currently estimated at $1,064,866, approximately $342 per square foot. 47532 Compton Cir is a home located in Loudoun County with nearby schools including Lowes Island Elementary School, Seneca Ridge Middle School, and Dominion High School.
Ownership History
Date
Name
Owned For
Owner Type
Purchase Details
Closed on
Apr 25, 2017
Sold by
Olsen Richard N
Bought by
Silva Cindy Diane and Silva Jose A
Current Estimated Value
Home Financials for this Owner
Home Financials are based on the most recent Mortgage that was taken out on this home.
Original Mortgage
$450,000
Outstanding Balance
$375,386
Interest Rate
4.3%
Mortgage Type
New Conventional
Estimated Equity
$689,480
Purchase Details
Closed on
Dec 29, 1995
Sold by
Pulte Home Corp
Bought by
Olsen Richard N
Home Financials for this Owner
Home Financials are based on the most recent Mortgage that was taken out on this home.
Original Mortgage
$324,450
Interest Rate
7.33%
Purchase Details
Closed on
Mar 1, 1995
Sold by
Bondy Way Dev Corp
Bought by
Pulte Home Corp
Create a Home Valuation Report for This Property
The Home Valuation Report is an in-depth analysis detailing your home's value as well as a comparison with similar homes in the area
Home Values in the Area
Average Home Value in this Area
Purchase History
| Date | Buyer | Sale Price | Title Company |
|---|---|---|---|
| Silva Cindy Diane | $680,000 | Attorney | |
| Olsen Richard N | $360,500 | -- | |
| Pulte Home Corp | $239,014 | -- |
Source: Public Records
Mortgage History
| Date | Status | Borrower | Loan Amount |
|---|---|---|---|
| Open | Silva Cindy Diane | $450,000 | |
| Previous Owner | Pulte Home Corp | $324,450 |
Source: Public Records
Tax History
| Year | Tax Paid | Tax Assessment Tax Assessment Total Assessment is a certain percentage of the fair market value that is determined by local assessors to be the total taxable value of land and additions on the property. | Land | Improvement |
|---|---|---|---|---|
| 2025 | $7,969 | $989,900 | $289,600 | $700,300 |
| 2024 | $7,257 | $838,910 | $289,600 | $549,310 |
| 2023 | $7,296 | $833,810 | $269,600 | $564,210 |
| 2022 | $7,422 | $833,900 | $269,600 | $564,300 |
| 2021 | $7,318 | $746,720 | $238,800 | $507,920 |
| 2020 | $7,221 | $697,710 | $208,800 | $488,910 |
| 2019 | $7,194 | $688,430 | $208,800 | $479,630 |
| 2018 | $7,382 | $680,410 | $208,800 | $471,610 |
| 2017 | $7,696 | $684,080 | $208,800 | $475,280 |
| 2016 | $7,800 | $681,190 | $0 | $0 |
| 2015 | $7,774 | $476,150 | $0 | $476,150 |
| 2014 | $7,894 | $474,690 | $0 | $474,690 |
Source: Public Records
Map
Nearby Homes
- 20548 Tidewater Ct
- 20443 Cliftons Point St
- 20630 Bridgeport Ct
- 20572 Willoughby Square
- 47569 Saulty Dr
- 20624 Muddy Harbour Square
- 20500 Tappahannock Place
- 20660 Muddy Harbour Square
- 47672 Paulsen Square
- 47666 Paulsen Square
- 20338 Cliftons Point St
- 47779 Tupelo Ct
- 47697 Whirlpool Square
- 47783 Macgill Ct
- 47787 Brawner Place
- 20209 Center Brook Square
- 47647 Sandbank Square
- 20461 Swan Creek Ct
- 47772 Scotsborough Square
- 20377 Cottswold Terrace Unit 73
- 47536 Compton Cir
- 47528 Compton Cir
- 47480 Saulty Dr
- 20545 Tidewater Ct
- 47476 Saulty Dr
- 47533 Compton Cir
- 47472 Saulty Dr
- 47524 Compton Cir
- 47525 Compton Cir
- 47540 Compton Cir
- 47484 Saulty Dr
- 20549 Tidewater Ct
- 20541 Tidewater Ct
- 47477 Saulty Dr
- 47545 Compton Cir
- 20540 Tidewater Ct
- 47488 Saulty Dr
- 47488 Saulty Dr Unit LOWES ISLAND
- 47520 Compton Cir
- 20553 Tidewater Ct
Your Personal Tour Guide
Ask me questions while you tour the home.