Estimated Value: $303,666 - $326,000
3
Beds
3
Baths
1,881
Sq Ft
$165/Sq Ft
Est. Value
About This Home
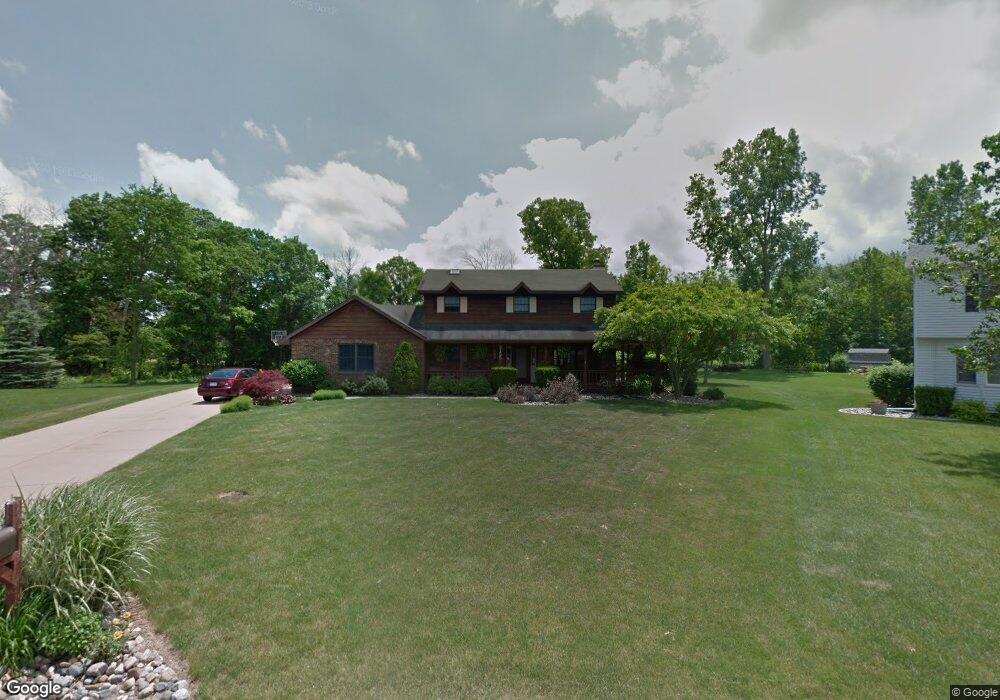
This home is located at 4755 Applecroft Ln, Holt, MI 48842 and is currently estimated at $311,167, approximately $165 per square foot. 4755 Applecroft Ln is a home located in Ingham County with nearby schools including Wilcox Elementary School, Holt Junior High School, and Washington Woods Middle School.
Ownership History
Date
Name
Owned For
Owner Type
Purchase Details
Closed on
Dec 3, 2013
Sold by
Bosak David
Bought by
Goodrich Karen
Current Estimated Value
Purchase Details
Closed on
Mar 28, 2003
Sold by
Goodrich Karen V
Bought by
Bosak David and Goodrich Karen V
Home Financials for this Owner
Home Financials are based on the most recent Mortgage that was taken out on this home.
Original Mortgage
$169,000
Interest Rate
5.86%
Mortgage Type
Purchase Money Mortgage
Purchase Details
Closed on
Sep 6, 2000
Sold by
Saxman Paul R
Bought by
Goodrich Kaven V
Purchase Details
Closed on
Apr 2, 1999
Sold by
Seehase David F and Seehase Cindy
Bought by
Saxman Paul R and Goodrich Saxman Karen V
Home Financials for this Owner
Home Financials are based on the most recent Mortgage that was taken out on this home.
Original Mortgage
$177,500
Interest Rate
7.1%
Mortgage Type
Purchase Money Mortgage
Create a Home Valuation Report for This Property
The Home Valuation Report is an in-depth analysis detailing your home's value as well as a comparison with similar homes in the area
Home Values in the Area
Average Home Value in this Area
Purchase History
| Date | Buyer | Sale Price | Title Company |
|---|---|---|---|
| Goodrich Karen | -- | None Available | |
| Bosak David | -- | Bell Title | |
| Goodrich Kaven V | -- | -- | |
| Saxman Paul R | $186,900 | First American Title Ins Co |
Source: Public Records
Mortgage History
| Date | Status | Borrower | Loan Amount |
|---|---|---|---|
| Previous Owner | Bosak David | $169,000 | |
| Previous Owner | Saxman Paul R | $177,500 |
Source: Public Records
Tax History
| Year | Tax Paid | Tax Assessment Tax Assessment Total Assessment is a certain percentage of the fair market value that is determined by local assessors to be the total taxable value of land and additions on the property. | Land | Improvement |
|---|---|---|---|---|
| 2025 | $5,235 | $147,600 | $25,000 | $122,600 |
| 2024 | $4,887 | $142,400 | $25,000 | $117,400 |
| 2023 | $4,887 | $127,400 | $20,500 | $106,900 |
| 2022 | $4,639 | $113,400 | $20,500 | $92,900 |
| 2021 | $4,512 | $108,600 | $15,700 | $92,900 |
| 2020 | $4,573 | $104,200 | $15,700 | $88,500 |
| 2019 | $4,432 | $102,100 | $14,300 | $87,800 |
| 2018 | $4,407 | $94,800 | $17,300 | $77,500 |
| 2017 | $4,031 | $94,800 | $17,300 | $77,500 |
| 2016 | $3,992 | $87,800 | $17,300 | $70,500 |
| 2015 | $3,932 | $86,500 | $34,500 | $52,000 |
| 2014 | $3,932 | $81,500 | $34,500 | $47,000 |
Source: Public Records
Map
Nearby Homes
- 1532 N Eifert Rd
- 5071 Haddon Hall Dr
- 1545 Thimbleberry Ln
- 4535 Harper Rd
- 5091 Runnymede Dr
- 4376 Davlind Dr
- 1951 Cromwell St
- 0 Aurelius Rd Unit 282659
- 1219 Wildflower Dr
- 5170 Beaumaris Cir
- 4592 Holt Rd
- 4139 Archwood Dr
- 1942 Walnut St
- V L 00 Holt Rd
- 1920 Schoolcraft St
- 4360 Holt Rd Unit 9
- 0 Eifert Rd
- 4245 Holt Rd
- 2122 Cedar St
- 2245 Main St
- 4765 Applecroft Ln
- 1500 Applecroft Ln
- 4775 Applecroft Ln
- 1510 Applecroft Ln
- 4770 Applecroft Ln
- 4785 Applecroft Ln
- 1520 Applecroft Ln
- 4780 Applecroft Ln
- 4795 Applecroft Ln
- 1525 Applecroft Ln
- 1530 Applecroft Ln
- 4800 Applecroft Ln
- 4805 Applecroft Ln
- 4810 Applecroft Ln
- 4779 Eastlund Cir
- 4815 Applecroft Ln
- 4752 Eastlund Cir
- 4762 Eastlund Cir
- 4820 Applecroft Ln
Your Personal Tour Guide
Ask me questions while you tour the home.