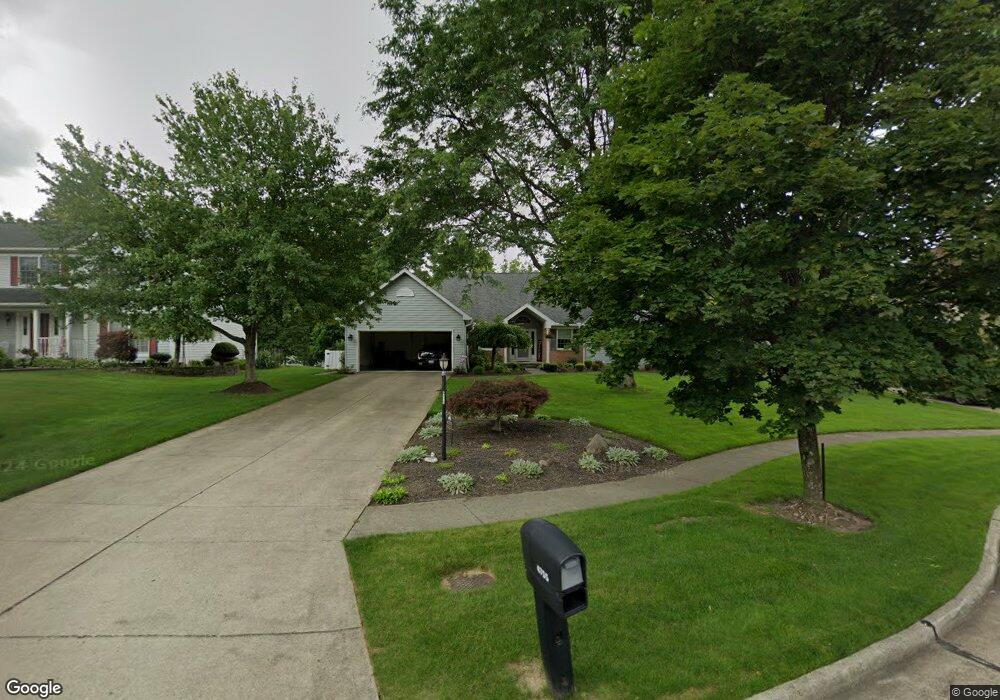
4755 Heather Ln North Royalton, OH 44133
Estimated Value: $391,228 - $430,000
3
Beds
3
Baths
2,194
Sq Ft
$183/Sq Ft
Est. Value
About This Home
This home is located at 4755 Heather Ln, North Royalton, OH 44133 and is currently estimated at $402,057, approximately $183 per square foot. 4755 Heather Ln is a home located in Cuyahoga County with nearby schools including North Royalton Middle School, North Royalton High School, and Saint Albert the Great Roman Catholic School.
Ownership History
Date
Name
Owned For
Owner Type
Purchase Details
Closed on
Jul 12, 2003
Sold by
Hoag James E and Hoag Veronica K
Bought by
Kucera Richard J and Kucera Sylvia A
Current Estimated Value
Home Financials for this Owner
Home Financials are based on the most recent Mortgage that was taken out on this home.
Original Mortgage
$75,000
Interest Rate
4.8%
Mortgage Type
Purchase Money Mortgage
Purchase Details
Closed on
Dec 15, 1995
Sold by
Naim Norman R
Bought by
Hoag James and Hoag Veronica
Home Financials for this Owner
Home Financials are based on the most recent Mortgage that was taken out on this home.
Original Mortgage
$184,000
Interest Rate
7.45%
Mortgage Type
Balloon
Purchase Details
Closed on
Oct 28, 1991
Bought by
Naim Elsie M
Purchase Details
Closed on
Sep 24, 1991
Bought by
Petros Homes Inc
Purchase Details
Closed on
Jan 1, 1991
Bought by
Ashley Dev Corp
Create a Home Valuation Report for This Property
The Home Valuation Report is an in-depth analysis detailing your home's value as well as a comparison with similar homes in the area
Home Values in the Area
Average Home Value in this Area
Purchase History
| Date | Buyer | Sale Price | Title Company |
|---|---|---|---|
| Kucera Richard J | $250,000 | Real Living Title Agency Ltd | |
| Hoag James | $230,000 | -- | |
| Naim Elsie M | $149,600 | -- | |
| Petros Homes Inc | -- | -- | |
| Ashley Dev Corp | -- | -- |
Source: Public Records
Mortgage History
| Date | Status | Borrower | Loan Amount |
|---|---|---|---|
| Closed | Kucera Richard J | $75,000 | |
| Closed | Hoag James | $184,000 | |
| Closed | Kucera Richard J | $125,000 |
Source: Public Records
Tax History Compared to Growth
Tax History
| Year | Tax Paid | Tax Assessment Tax Assessment Total Assessment is a certain percentage of the fair market value that is determined by local assessors to be the total taxable value of land and additions on the property. | Land | Improvement |
|---|---|---|---|---|
| 2024 | $6,840 | $127,540 | $28,385 | $99,155 |
| 2023 | $6,706 | $115,050 | $26,290 | $88,760 |
| 2022 | $6,687 | $115,050 | $26,290 | $88,760 |
| 2021 | $6,757 | $115,050 | $26,290 | $88,760 |
| 2020 | $6,047 | $99,160 | $22,650 | $76,510 |
| 2019 | $5,870 | $283,300 | $64,700 | $218,600 |
| 2018 | $5,597 | $99,160 | $22,650 | $76,510 |
| 2017 | $5,615 | $90,480 | $17,120 | $73,360 |
| 2016 | $5,262 | $90,480 | $17,120 | $73,360 |
| 2015 | $5,261 | $90,480 | $17,120 | $73,360 |
| 2014 | $5,303 | $90,480 | $17,120 | $73,360 |
Source: Public Records
Map
Nearby Homes
- 5299 Whistler Ct
- 4428 Akins Rd
- 5213 Royalton Rd
- 4161 Akins Rd
- 0 Valley Pkwy Unit 5118483
- 6689 Willow Lake Dr
- 16577 State Rd
- 7400 Akins Rd
- 4863 Maple Ln
- 11490 Lisa Ln
- 7340 Creekwood Dr Unit 5A
- 7332 Creekwood Dr Unit 4B
- 2301 W Royalton Rd
- 17440 Sawgrass Cir
- 12862 Ridge Rd
- 2022 Akins Rd
- LUCAS TH Plan at The Ledges
- LIBBY TH Plan at The Ledges
- ABBY TH Plan at The Ledges
- 9125 Ledge View Terrace
- 4745 Heather Ln
- 14196 Catherine Ct
- 4735 Heather Ln
- 14188 Catherine Ct
- 14173 Catherine Ct
- 14180 Catherine Ct
- 4725 Heather Ln
- 14172 Catherine Ct
- 4715 Heather Ln
- 4722 Heather Ln
- 14163 Catherine Ct
- 14982 Highland Dr
- 14164 Catherine Ct
- 14157 Catherine Ct
- 4712 Heather Ln
- 15000 Highland Dr
- 4705 Heather Ln
- 14156 Catherine Ct
- 14148 Catherine Ct
- 4695 Heather Ln