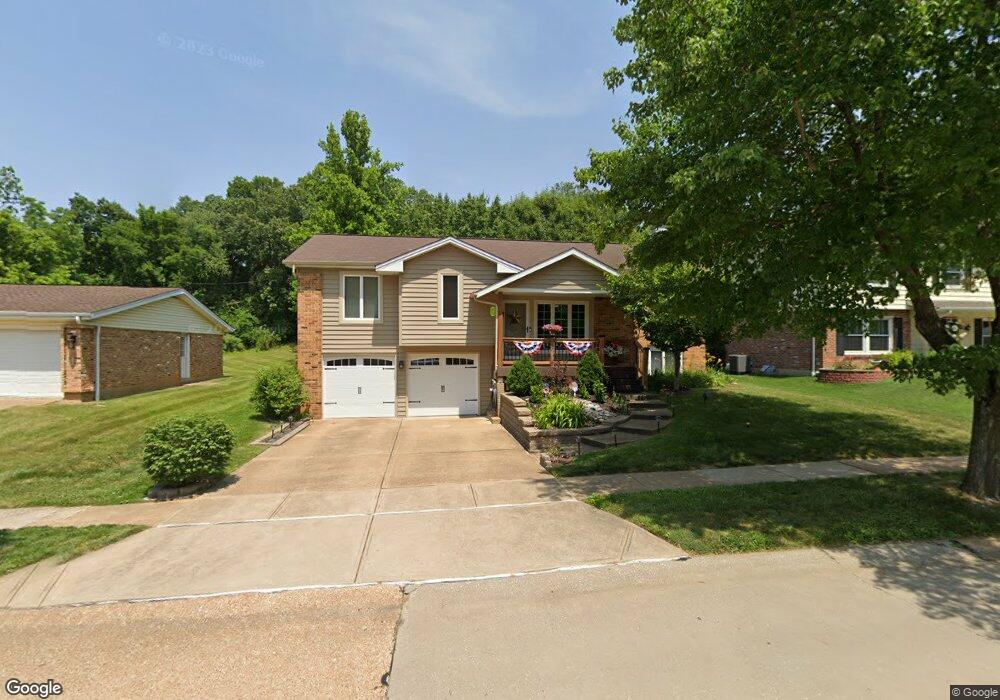
4755 Melissa Jo Ln Saint Louis, MO 63128
Estimated Value: $318,925 - $365,000
4
Beds
3
Baths
1,899
Sq Ft
$178/Sq Ft
Est. Value
About This Home
This home is located at 4755 Melissa Jo Ln, Saint Louis, MO 63128 and is currently estimated at $337,481, approximately $177 per square foot. 4755 Melissa Jo Ln is a home located in St. Louis County with nearby schools including Hagemann Elementary School, Washington Middle School, and Mehlville High School.
Ownership History
Date
Name
Owned For
Owner Type
Purchase Details
Closed on
Jul 30, 2007
Sold by
Naes Keith F and Naes Chanda K
Bought by
Price Raphael M
Current Estimated Value
Home Financials for this Owner
Home Financials are based on the most recent Mortgage that was taken out on this home.
Original Mortgage
$177,000
Outstanding Balance
$111,206
Interest Rate
6.69%
Mortgage Type
Purchase Money Mortgage
Estimated Equity
$226,275
Purchase Details
Closed on
Apr 16, 2001
Sold by
Burris Dana L and Burris Sandra L
Bought by
Naes Keith F and Naes Chanda K
Home Financials for this Owner
Home Financials are based on the most recent Mortgage that was taken out on this home.
Original Mortgage
$148,000
Interest Rate
6.93%
Purchase Details
Closed on
Oct 29, 1999
Sold by
Dehahn Bernard J and Dehahn Bonnie L
Bought by
Burris Dana L and Burris Sandra L
Home Financials for this Owner
Home Financials are based on the most recent Mortgage that was taken out on this home.
Original Mortgage
$126,000
Interest Rate
7.77%
Create a Home Valuation Report for This Property
The Home Valuation Report is an in-depth analysis detailing your home's value as well as a comparison with similar homes in the area
Home Values in the Area
Average Home Value in this Area
Purchase History
| Date | Buyer | Sale Price | Title Company |
|---|---|---|---|
| Price Raphael M | $212,000 | None Available | |
| Naes Keith F | $156,000 | First American Title | |
| Naes Keith F | -- | First American Title | |
| Burris Dana L | $140,000 | -- |
Source: Public Records
Mortgage History
| Date | Status | Borrower | Loan Amount |
|---|---|---|---|
| Open | Price Raphael M | $177,000 | |
| Previous Owner | Naes Keith F | $148,000 | |
| Previous Owner | Burris Dana L | $126,000 |
Source: Public Records
Tax History Compared to Growth
Tax History
| Year | Tax Paid | Tax Assessment Tax Assessment Total Assessment is a certain percentage of the fair market value that is determined by local assessors to be the total taxable value of land and additions on the property. | Land | Improvement |
|---|---|---|---|---|
| 2025 | $3,009 | $53,220 | $24,530 | $28,690 |
| 2024 | $3,009 | $44,710 | $13,130 | $31,580 |
| 2023 | $3,009 | $44,710 | $13,130 | $31,580 |
| 2022 | $2,727 | $41,230 | $11,400 | $29,830 |
| 2021 | $2,639 | $41,230 | $11,400 | $29,830 |
| 2020 | $2,587 | $38,430 | $9,630 | $28,800 |
| 2019 | $2,579 | $38,430 | $9,630 | $28,800 |
| 2018 | $2,625 | $35,320 | $8,760 | $26,560 |
| 2017 | $2,621 | $35,320 | $8,760 | $26,560 |
| 2016 | $2,600 | $33,610 | $8,760 | $24,850 |
| 2015 | $2,387 | $33,610 | $8,760 | $24,850 |
| 2014 | $2,119 | $29,490 | $6,180 | $23,310 |
Source: Public Records
Map
Nearby Homes
- 5812 Chrisbrook Dr
- 5626 Greenton Way
- 4968 Quail Crest Ct
- 5028 Baldcypress Ct
- 5714 Shining Day Place
- 5952 Shortleaf Ct
- 4716 Medalton Way
- 4523 Beaver Brook Ct
- 5414 Village Courtway Ln
- 5174 Hollow Wood Ct Unit C
- 5162 Hollow Wood Ct Unit D
- 5401 Green Cedar Way Unit 6
- 5100 Hollow Wood Ct Unit D
- 5106 Hollow Wood Ct Unit C
- 13266 East Ln
- 6006 Grand Marnier Dr
- 13232 East Ln
- 5417 Morningdale Place
- 6055 Bayou Bend Ct
- 5942 Hawkins Fuchs Rd
- 4749 Melissa Jo Ln
- 4761 Melissa Jo Ln
- 4741 Melissa Jo Ln
- 4754 Melissa Jo Ln
- 4760 Melissa Jo Ln
- 4748 Melissa Jo Ln
- 4768 Melissa Jo Ln
- 4733 Melissa Jo Ln
- 4742 Melissa Jo Ln
- 4691 Karamar Dr
- 4736 Melissa Jo Ln
- 4775 Melissa Jo Ln
- 4808 Melissa Jo Ln
- 4730 Melissa Jo Ln
- 4685 Karamar Dr
- 4806 Royal King Ct
- 5706 Karamar Dr
- 4803 Melissa Jo Ln
- 5714 Karamar Dr
- 4692 Karamar Dr