Estimated Value: $468,000 - $581,000
3
Beds
3
Baths
1,818
Sq Ft
$276/Sq Ft
Est. Value
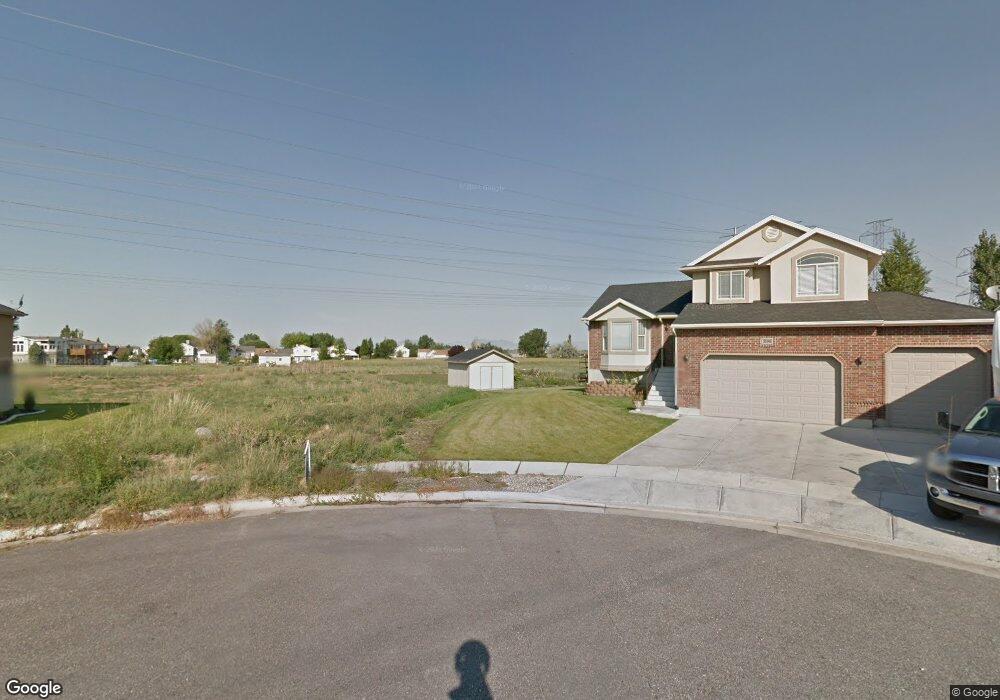
About This Home
This home is located at 4755 S 3200 W, Roy, UT 84067 and is currently estimated at $502,659, approximately $276 per square foot. 4755 S 3200 W is a home located in Weber County with nearby schools including Midland School, Sand Ridge Junior High School, and Roy High School.
Ownership History
Date
Name
Owned For
Owner Type
Purchase Details
Closed on
May 29, 2018
Sold by
Miller Joseph D and Miller Serina Y
Bought by
Bott Tyler F and Bott Shaylynne
Current Estimated Value
Home Financials for this Owner
Home Financials are based on the most recent Mortgage that was taken out on this home.
Original Mortgage
$242,500
Outstanding Balance
$209,248
Interest Rate
4.4%
Mortgage Type
New Conventional
Estimated Equity
$293,411
Purchase Details
Closed on
Aug 7, 2014
Sold by
Dream Castle Homes Inc
Bought by
Miller Joseph D and Miller Serina Y
Home Financials for this Owner
Home Financials are based on the most recent Mortgage that was taken out on this home.
Original Mortgage
$7,801
Interest Rate
4.12%
Mortgage Type
Stand Alone Second
Purchase Details
Closed on
May 30, 2007
Sold by
Crouch Bruce A
Bought by
Bradshaw Chris and Dellalucia Sarah
Purchase Details
Closed on
Dec 13, 2005
Sold by
Parkridge Inc
Bought by
Crouch Bruce A
Create a Home Valuation Report for This Property
The Home Valuation Report is an in-depth analysis detailing your home's value as well as a comparison with similar homes in the area
Home Values in the Area
Average Home Value in this Area
Purchase History
| Date | Buyer | Sale Price | Title Company |
|---|---|---|---|
| Bott Tyler F | -- | Us Title Insurance Agency | |
| Miller Joseph D | -- | None Available | |
| Bradshaw Chris | -- | First American Title Layton | |
| Crouch Bruce A | -- | -- |
Source: Public Records
Mortgage History
| Date | Status | Borrower | Loan Amount |
|---|---|---|---|
| Open | Bott Tyler F | $242,500 | |
| Previous Owner | Miller Joseph D | $7,801 | |
| Previous Owner | Miller Joseph D | $195,044 |
Source: Public Records
Tax History
| Year | Tax Paid | Tax Assessment Tax Assessment Total Assessment is a certain percentage of the fair market value that is determined by local assessors to be the total taxable value of land and additions on the property. | Land | Improvement |
|---|---|---|---|---|
| 2025 | $2,956 | $470,680 | $155,798 | $314,882 |
| 2024 | $2,888 | $254,649 | $85,688 | $168,961 |
| 2023 | $2,924 | $259,600 | $78,258 | $181,342 |
| 2022 | $2,824 | $256,300 | $66,032 | $190,268 |
| 2021 | $2,360 | $352,000 | $92,448 | $259,552 |
| 2020 | $2,186 | $299,000 | $92,448 | $206,552 |
| 2019 | $2,174 | $281,000 | $56,035 | $224,965 |
| 2018 | $2,107 | $257,000 | $51,564 | $205,436 |
| 2017 | $2,072 | $238,000 | $51,564 | $186,436 |
| 2016 | $1,935 | $119,207 | $26,647 | $92,560 |
| 2015 | $1,779 | $112,149 | $26,647 | $85,502 |
| 2014 | $884 | $48,449 | $48,449 | $0 |
Source: Public Records
Map
Nearby Homes
- 4793 S 3025 W
- 3022 W 4750 S
- 4510 Stone Creek Rd Unit F
- 2953 W 4650 S
- 4491 Haven Creek Rd Unit A
- 3405 W 4525 S
- 4891 S 2875 W
- 4435 Cross Creek Rd Unit 29C
- 3509 W 4835 S Unit 26
- 3517 W 4835 S Unit 27
- 5009 S 2925 W
- 5155 S 3200 W
- 4324 S 3350 W
- 5141 S 2975 W
- 2817 W 5000 S
- 4732 S West Park Dr
- 5063 S 2825 W
- 4317 S 3350 W
- 4322 S 3450 W
- 3610 W 4475 S
- 4755 S 3200 W Unit 8
- 3196 W 4750 S
- 3196 W 4750 S Unit 7
- 4767 S 3200 W
- 4767 S 3200 W Unit 9
- 3186 W 4750 S
- 3186 W 4750 S Unit 6
- 4723 S 3200 W
- 4779 S 3200 W
- 4779 S 3200 W
- 4779 S 3200 W Unit 10
- 3183 W 4750 S
- 3183 W 4750 S Unit 5
- 3193 W 4725 S
- 3185 W 4725 S
- 4791 S 3200 W
- 4791 S 3200 W Unit 11
- 4711 S 3200 W
- 3173 W 4750 S
- 3173 W 4750 S Unit 4
Your Personal Tour Guide
Ask me questions while you tour the home.