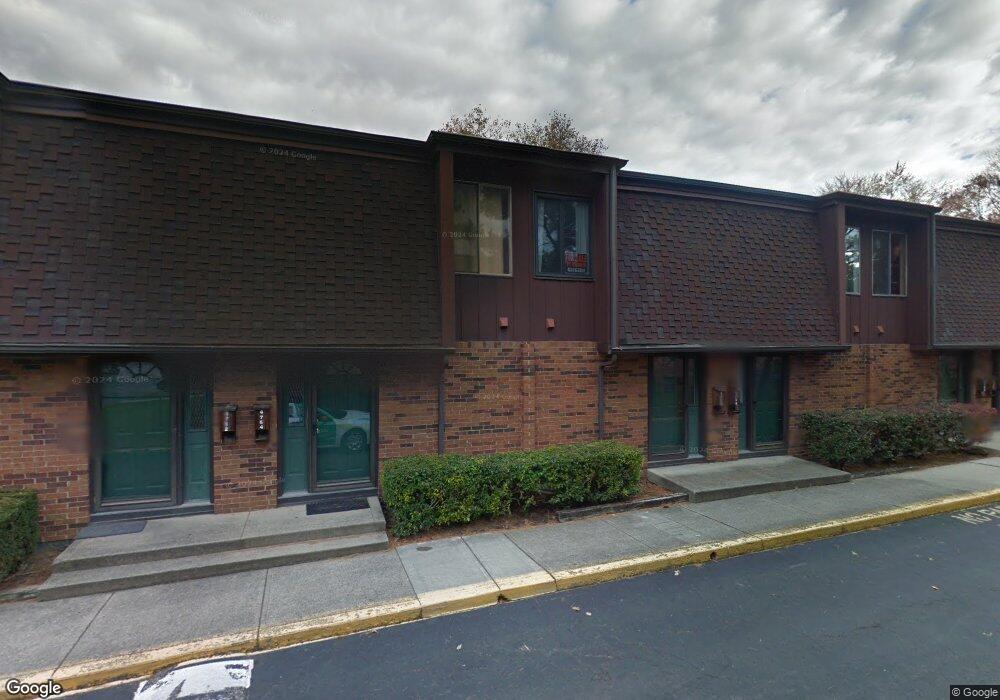
4756 Shell Ct S Unit G4756 Columbus, OH 43213
Estimated Value: $130,000 - $148,000
2
Beds
2
Baths
952
Sq Ft
$147/Sq Ft
Est. Value
About This Home
This home is located at 4756 Shell Ct S Unit G4756, Columbus, OH 43213 and is currently estimated at $139,921, approximately $146 per square foot. 4756 Shell Ct S Unit G4756 is a home located in Franklin County with nearby schools including Etna Road Elementary School, Beechwood Elementary School, and Rosemore Middle School.
Ownership History
Date
Name
Owned For
Owner Type
Purchase Details
Closed on
May 10, 2016
Sold by
Wollett Cheryl Sue
Bought by
Bogale Serkalem T
Current Estimated Value
Purchase Details
Closed on
May 13, 2014
Sold by
Debolt Burl E
Bought by
Debolt Burl E and Wollett Cheryl Sue
Purchase Details
Closed on
Mar 30, 2005
Sold by
Winn Sandra K and Foxfire Village Condominium Un
Bought by
Debolt Burl E and Debolt Mattie L
Purchase Details
Closed on
Jul 27, 2001
Sold by
Heilman Thomas P
Bought by
Winn Sandra K and Foxfire Village Condominium Un
Home Financials for this Owner
Home Financials are based on the most recent Mortgage that was taken out on this home.
Original Mortgage
$311,000
Interest Rate
7.15%
Mortgage Type
Purchase Money Mortgage
Purchase Details
Closed on
Jun 1, 1994
Sold by
Russo Arthur F
Bought by
Thomas P Heilman
Purchase Details
Closed on
Nov 4, 1993
Create a Home Valuation Report for This Property
The Home Valuation Report is an in-depth analysis detailing your home's value as well as a comparison with similar homes in the area
Home Values in the Area
Average Home Value in this Area
Purchase History
| Date | Buyer | Sale Price | Title Company |
|---|---|---|---|
| Bogale Serkalem T | $38,000 | None Available | |
| Debolt Burl E | -- | None Available | |
| Debolt Burl E | $50,000 | Trinity Tit | |
| Winn Sandra K | $160,000 | Lawyers Title | |
| Thomas P Heilman | $12,500 | -- | |
| -- | $27,500 | -- |
Source: Public Records
Mortgage History
| Date | Status | Borrower | Loan Amount |
|---|---|---|---|
| Previous Owner | Winn Sandra K | $311,000 |
Source: Public Records
Tax History Compared to Growth
Tax History
| Year | Tax Paid | Tax Assessment Tax Assessment Total Assessment is a certain percentage of the fair market value that is determined by local assessors to be the total taxable value of land and additions on the property. | Land | Improvement |
|---|---|---|---|---|
| 2024 | $1,237 | $28,290 | $5,780 | $22,510 |
| 2023 | $1,228 | $28,280 | $5,775 | $22,505 |
| 2022 | $958 | $16,770 | $1,890 | $14,880 |
| 2021 | $899 | $16,770 | $1,890 | $14,880 |
| 2020 | $890 | $16,770 | $1,890 | $14,880 |
| 2019 | $759 | $12,430 | $1,400 | $11,030 |
| 2018 | $387 | $12,430 | $1,400 | $11,030 |
| 2017 | $767 | $12,430 | $1,400 | $11,030 |
| 2016 | $800 | $11,910 | $2,210 | $9,700 |
| 2015 | $403 | $11,910 | $2,210 | $9,700 |
| 2014 | $208 | $11,910 | $2,210 | $9,700 |
| 2013 | $165 | $14,000 | $2,590 | $11,410 |
Source: Public Records
Map
Nearby Homes
- 353 Shell Ct E
- 469 Cumberland Dr
- 571 S Hamilton Rd
- 4780 Etna Rd Unit 782
- 424 Cumberland Dr
- 4653 Kae Ave
- 451 Beaver Ave
- 547 Country Club Rd
- 4662 Jae Ave
- 4489 Saint Margaret Ln
- 322 Fairway Cir
- 579 Westphal Ave
- 4368 Broadhurst Dr
- 686 Fairway Blvd
- 855 Dimson Dr E
- 4212 Seigman Ave
- 931 Antwerp Rd
- 4232 Mayflower Blvd
- 4148 Elbern Ave
- 1085 S Hamilton Rd
- 4754 Shell Ct S Unit G4754
- 4758 Shell Ct S Unit G4758
- 4752 Shell Ct S
- 4760 Shell Ct S
- 4750 Shell Ct S Unit G4750
- 4762 Shell Ct S Unit 4762
- 4764 Shell Ct S Unit G4764
- 448 Shell Ct W
- 4766 Shell Ct S
- 446 Shell Ct W
- 444 Shell Ct W
- 4768 Shell Ct S
- 468 Shell Ct W
- 442 Shell Ct W Unit E442
- 466 Shell Ct W
- 440 Shell Ct W Unit E440B
- 464 Shell Ct W
- 438 Shell Ct W Unit E438
- 462 Shell Ct W Unit F462
- 436 Shell Ct W