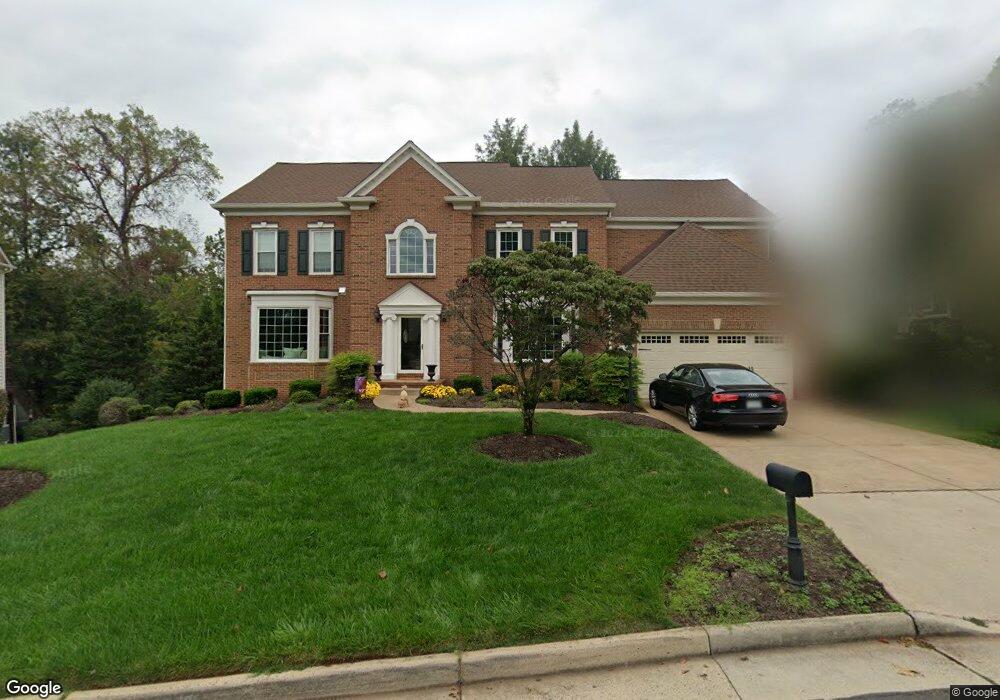
47568 Compton Cir Sterling, VA 20165
Estimated Value: $1,098,032 - $1,288,000
4
Beds
4
Baths
3,665
Sq Ft
$325/Sq Ft
Est. Value
About This Home
This home is located at 47568 Compton Cir, Sterling, VA 20165 and is currently estimated at $1,190,508, approximately $324 per square foot. 47568 Compton Cir is a home located in Loudoun County with nearby schools including Lowes Island Elementary School, Seneca Ridge Middle School, and Dominion High School.
Ownership History
Date
Name
Owned For
Owner Type
Purchase Details
Closed on
Mar 21, 2011
Sold by
Mineghino Vincent F
Bought by
Wajsgras Richard G
Current Estimated Value
Home Financials for this Owner
Home Financials are based on the most recent Mortgage that was taken out on this home.
Original Mortgage
$584,000
Outstanding Balance
$402,210
Interest Rate
4.84%
Mortgage Type
New Conventional
Estimated Equity
$788,298
Purchase Details
Closed on
Feb 22, 1999
Sold by
Mullins Michael L
Bought by
Mineghino Vincent F
Home Financials for this Owner
Home Financials are based on the most recent Mortgage that was taken out on this home.
Original Mortgage
$274,000
Interest Rate
6.78%
Purchase Details
Closed on
Feb 15, 1995
Sold by
Pulte Home Corp
Bought by
Millins Michael L
Home Financials for this Owner
Home Financials are based on the most recent Mortgage that was taken out on this home.
Original Mortgage
$203,150
Interest Rate
9.19%
Create a Home Valuation Report for This Property
The Home Valuation Report is an in-depth analysis detailing your home's value as well as a comparison with similar homes in the area
Home Values in the Area
Average Home Value in this Area
Purchase History
| Date | Buyer | Sale Price | Title Company |
|---|---|---|---|
| Wajsgras Richard G | $730,000 | -- | |
| Mineghino Vincent F | $424,000 | -- | |
| Millins Michael L | $415,720 | -- |
Source: Public Records
Mortgage History
| Date | Status | Borrower | Loan Amount |
|---|---|---|---|
| Open | Wajsgras Richard G | $584,000 | |
| Previous Owner | Mineghino Vincent F | $274,000 | |
| Previous Owner | Millins Michael L | $203,150 |
Source: Public Records
Tax History
| Year | Tax Paid | Tax Assessment Tax Assessment Total Assessment is a certain percentage of the fair market value that is determined by local assessors to be the total taxable value of land and additions on the property. | Land | Improvement |
|---|---|---|---|---|
| 2025 | $8,622 | $1,071,010 | $289,500 | $781,510 |
| 2024 | $7,807 | $902,520 | $289,500 | $613,020 |
| 2023 | $7,965 | $910,260 | $269,500 | $640,760 |
| 2022 | $8,137 | $914,220 | $269,500 | $644,720 |
| 2021 | $8,029 | $819,330 | $238,500 | $580,830 |
| 2020 | $7,923 | $765,480 | $208,500 | $556,980 |
| 2019 | $7,897 | $755,670 | $208,500 | $547,170 |
| 2018 | $8,100 | $746,550 | $208,500 | $538,050 |
| 2017 | $8,527 | $757,950 | $208,500 | $549,450 |
| 2016 | $8,321 | $726,730 | $0 | $0 |
| 2015 | $8,345 | $526,730 | $0 | $526,730 |
| 2014 | $8,474 | $525,200 | $0 | $525,200 |
Source: Public Records
Map
Nearby Homes
- 20443 Cliftons Point St
- 20548 Tidewater Ct
- 47672 Paulsen Square
- 20572 Willoughby Square
- 20338 Cliftons Point St
- 47666 Paulsen Square
- 47569 Saulty Dr
- 20500 Tappahannock Place
- 20624 Muddy Harbour Square
- 20660 Muddy Harbour Square
- 20209 Center Brook Square
- 47779 Tupelo Ct
- 47783 Macgill Ct
- 47772 Scotsborough Square
- 20377 Cottswold Terrace Unit 73
- 20378 Cottswold Terrace Unit 67
- 47787 Brawner Place
- 20461 Swan Creek Ct
- 47784 Fathom Place
- 47647 Sandbank Square
- 47564 Compton Cir
- 47572 Compton Cir
- 47553 Griffith Place
- 47573 Compton Cir
- 47565 Compton Cir
- 47557 Griffith Place
- 47560 Compton Cir
- 47549 Griffith Place
- 47576 Compton Cir
- 47561 Griffith Place
- 47581 Compton Cir
- 47557 Compton Cir
- 47556 Compton Cir
- 47580 Compton Cir
- 47565 Griffith Place
- 47584 Compton Cir
- 20401 Stillhouse Branch Place
- 47556 Griffith Place
- 47552 Compton Cir
- 47509 Compton Cir
Your Personal Tour Guide
Ask me questions while you tour the home.