Estimated Value: $745,000 - $950,000
6
Beds
3
Baths
3,049
Sq Ft
$284/Sq Ft
Est. Value
About This Home
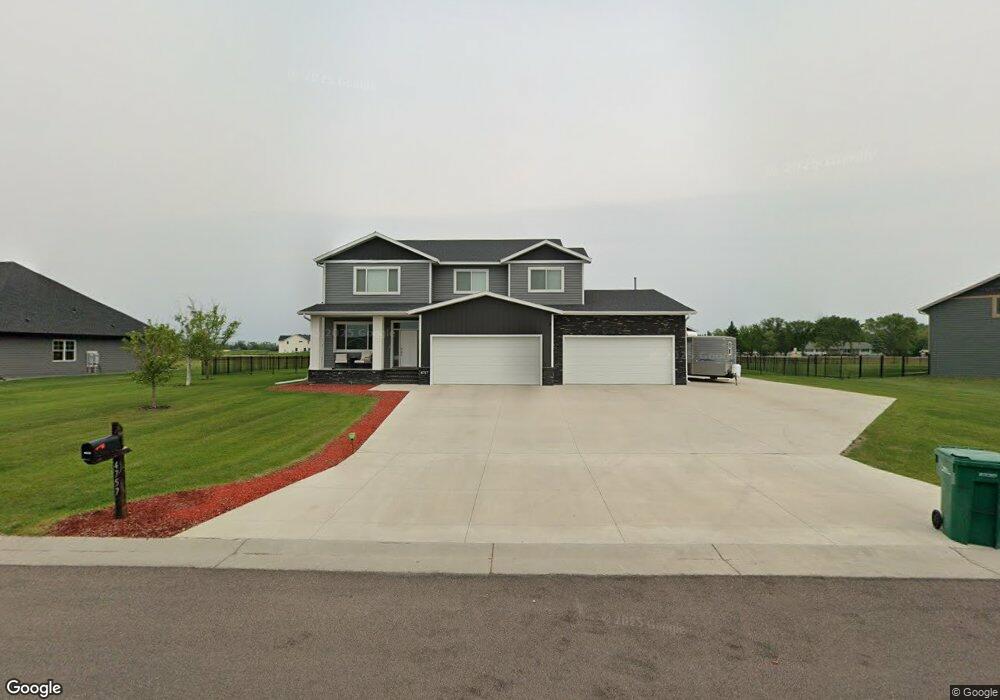
This home is located at 4757 39 1/2 Ave N, Fargo, ND 58102 and is currently estimated at $865,397, approximately $283 per square foot. 4757 39 1/2 Ave N is a home with nearby schools including Harwood Elementary School, Cheney Middle School, and West Fargo High School.
Ownership History
Date
Name
Owned For
Owner Type
Purchase Details
Closed on
Dec 23, 2019
Sold by
Designer Homes Of Fargo Moorhead Llc
Bought by
Kenninger Randall and Kenninger Brittany
Current Estimated Value
Home Financials for this Owner
Home Financials are based on the most recent Mortgage that was taken out on this home.
Original Mortgage
$484,350
Outstanding Balance
$427,859
Interest Rate
3.7%
Mortgage Type
New Conventional
Estimated Equity
$437,538
Purchase Details
Closed on
Jun 28, 2019
Sold by
Rln Business Park Llc
Bought by
Desinger Homes Of Fargo Moorhead Llc
Home Financials for this Owner
Home Financials are based on the most recent Mortgage that was taken out on this home.
Original Mortgage
$84,400
Interest Rate
3.9%
Mortgage Type
Commercial
Create a Home Valuation Report for This Property
The Home Valuation Report is an in-depth analysis detailing your home's value as well as a comparison with similar homes in the area
Home Values in the Area
Average Home Value in this Area
Purchase History
| Date | Buyer | Sale Price | Title Company |
|---|---|---|---|
| Kenninger Randall | $835,992 | Fm Title | |
| Desinger Homes Of Fargo Moorhead Llc | $105,500 | Fm Title |
Source: Public Records
Mortgage History
| Date | Status | Borrower | Loan Amount |
|---|---|---|---|
| Open | Kenninger Randall | $484,350 | |
| Previous Owner | Desinger Homes Of Fargo Moorhead Llc | $84,400 |
Source: Public Records
Tax History Compared to Growth
Tax History
| Year | Tax Paid | Tax Assessment Tax Assessment Total Assessment is a certain percentage of the fair market value that is determined by local assessors to be the total taxable value of land and additions on the property. | Land | Improvement |
|---|---|---|---|---|
| 2024 | $9,038 | $458,850 | $52,300 | $406,550 |
| 2023 | $9,180 | $442,950 | $52,300 | $390,650 |
| 2022 | $8,822 | $408,800 | $52,300 | $356,500 |
| 2021 | $7,866 | $351,900 | $52,300 | $299,600 |
| 2020 | $7,506 | $339,750 | $52,300 | $287,450 |
| 2019 | $873 | $36,600 | $36,600 | $0 |
| 2018 | $859 | $36,600 | $36,600 | $0 |
| 2017 | $795 | $36,750 | $36,750 | $0 |
| 2016 | $123 | $4,150 | $4,150 | $0 |
| 2015 | $118 | $4,150 | $4,150 | $0 |
Source: Public Records
Map
Nearby Homes
- 4771 39 1/2 Ave N
- 4756 39 1/2 Ave N
- 4720 39 1/2 Ave N
- 4713 39 1 2 Ave N
- 4713 39 1/2 Ave N
- 4709 39 1/2 Ave N
- 4706 39 1 2 Ave N
- 4014 47th St N
- 4706 39 1/2 Ave N
- 4755 39th Ave N
- 4769 39th Ave N
- 4769 39th St S
- 4807 39 1 2 Ave N
- 4791 39th Ave N
- 4859 39 1/2 Ave N
- 4859 39 1 2 Ave N
- 4805 39th Ave N
- 4768 39th Ave N
- 4858 39 1 2 Ave N
- 4790 39th Ave N