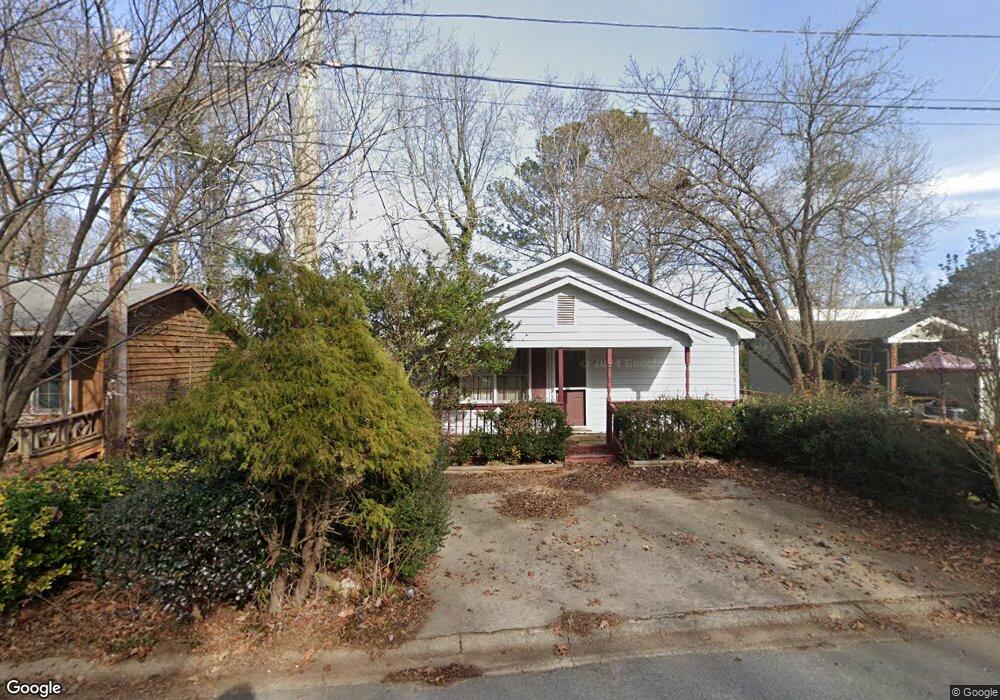
4757 Pebble Trace Buford, GA 30518
Estimated Value: $281,000 - $316,957
3
Beds
2
Baths
1,024
Sq Ft
$293/Sq Ft
Est. Value
About This Home
This home is located at 4757 Pebble Trace, Buford, GA 30518 and is currently estimated at $299,739, approximately $292 per square foot. 4757 Pebble Trace is a home located in Gwinnett County with nearby schools including Buford Elementary School, Buford Senior Academy, and Buford Academy.
Ownership History
Date
Name
Owned For
Owner Type
Purchase Details
Closed on
Feb 12, 2013
Sold by
Citifinancial Svcs Inc
Bought by
Blas-Jimenez Raymundo
Current Estimated Value
Purchase Details
Closed on
Mar 19, 1999
Sold by
Cook Tracy A
Bought by
Johnson Trina
Home Financials for this Owner
Home Financials are based on the most recent Mortgage that was taken out on this home.
Original Mortgage
$59,950
Interest Rate
6.82%
Mortgage Type
FHA
Purchase Details
Closed on
Nov 4, 1997
Sold by
Lee Larry N and Harmon Murl E
Bought by
Chase Mtg Svcs Inc
Purchase Details
Closed on
Sep 26, 1994
Sold by
Secretary Of Hud
Bought by
Lee Larry N Murl E
Home Financials for this Owner
Home Financials are based on the most recent Mortgage that was taken out on this home.
Original Mortgage
$51,636
Interest Rate
8.53%
Mortgage Type
FHA
Create a Home Valuation Report for This Property
The Home Valuation Report is an in-depth analysis detailing your home's value as well as a comparison with similar homes in the area
Home Values in the Area
Average Home Value in this Area
Purchase History
| Date | Buyer | Sale Price | Title Company |
|---|---|---|---|
| Blas-Jimenez Raymundo | $14,900 | -- | |
| Johnson Trina | $60,000 | -- | |
| Chase Mtg Svcs Inc | $62,540 | -- | |
| Lee Larry N Murl E | -- | -- |
Source: Public Records
Mortgage History
| Date | Status | Borrower | Loan Amount |
|---|---|---|---|
| Previous Owner | Johnson Trina | $59,950 | |
| Previous Owner | Lee Larry N Murl E | $51,636 |
Source: Public Records
Tax History Compared to Growth
Tax History
| Year | Tax Paid | Tax Assessment Tax Assessment Total Assessment is a certain percentage of the fair market value that is determined by local assessors to be the total taxable value of land and additions on the property. | Land | Improvement |
|---|---|---|---|---|
| 2024 | $1,580 | $110,120 | $19,600 | $90,520 |
| 2023 | $1,580 | $110,120 | $19,600 | $90,520 |
| 2022 | $1,242 | $86,520 | $16,000 | $70,520 |
| 2021 | $770 | $53,680 | $8,000 | $45,680 |
| 2020 | $770 | $53,680 | $8,000 | $45,680 |
| 2019 | $572 | $44,120 | $8,000 | $36,120 |
| 2018 | $572 | $44,120 | $8,000 | $36,120 |
| 2016 | $365 | $28,480 | $4,000 | $24,480 |
| 2015 | $338 | $25,480 | $4,000 | $21,480 |
| 2014 | $80 | $5,960 | $3,000 | $2,960 |
Source: Public Records
Map
Nearby Homes
- 0 Arden Dr Unit 10578909
- 0 Arden Dr Unit 7627968
- 2938 Pebblebrook Dr
- 2740 Blake Towers Ln
- 2910 Blake Towers Ln
- 2930 Blake Towers Ln
- 2307 Loughridge Dr
- 4298 Friar Tuck Ln
- 405 Thunder Rd
- 1098 Caruso Dr
- 4375 Easter Lily Ave
- 3021 Sea Aster Way
- 3016 Sea Aster Way
- 3273 N Bogan Rd
- 4679 Silver Meadow Dr
- 2802 Lakeview Ct
- 3271 Meadow Lily Ct
- 4650 Silver Meadow Dr
- 4753 Pebble Trace
- 4761 Pebble Trace
- 4715 Pebble Ct
- 4765 Pebble Trace
- 4749 Pebble Trace Unit 3
- 4716 Pebble Ct
- 4711 Pebble Ct
- 4711 Pebble Ct
- 4758 Pebble Trace
- 4678 Vintage Ct
- 4682 Vintage Ct
- 4762 Pebble Trace
- 4754 Pebble Trace
- 0 Pebble Trace Unit 8698095
- 0 Pebble Trace
- 4766 Pebble Trace
- 4744 Arden Dr
- 4769 Pebble Trace
- 4774 Pebble Trace
- 4750 Arden Dr