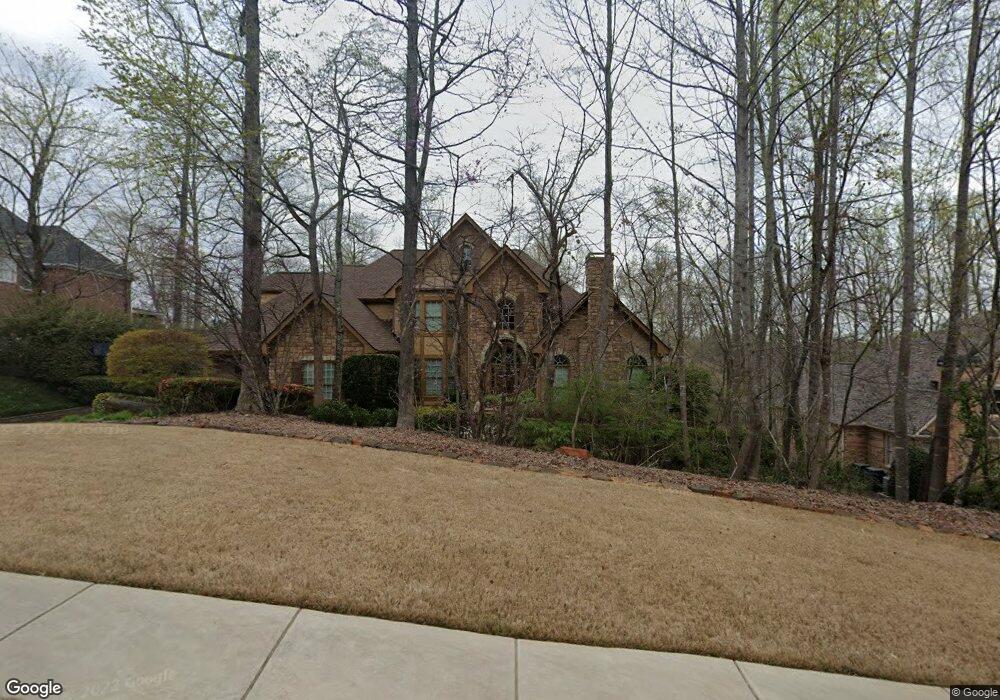
4758 Ardmore Ln Hoschton, GA 30548
Estimated Value: $794,000 - $854,757
5
Beds
5
Baths
4,103
Sq Ft
$201/Sq Ft
Est. Value
About This Home
This home is located at 4758 Ardmore Ln, Hoschton, GA 30548 and is currently estimated at $826,689, approximately $201 per square foot. 4758 Ardmore Ln is a home located in Gwinnett County with nearby schools including Duncan Creek Elementary School, Frank N. Osborne Middle School, and Mill Creek High School.
Ownership History
Date
Name
Owned For
Owner Type
Purchase Details
Closed on
Apr 25, 2005
Sold by
Gomez Francisco J
Bought by
Gomez Francisco J and Gomez Cynthia
Current Estimated Value
Home Financials for this Owner
Home Financials are based on the most recent Mortgage that was taken out on this home.
Original Mortgage
$300,000
Outstanding Balance
$156,005
Interest Rate
6%
Estimated Equity
$670,684
Purchase Details
Closed on
Jun 29, 2004
Sold by
Yee Maurine
Bought by
Artisan Home Builders Group Inc
Home Financials for this Owner
Home Financials are based on the most recent Mortgage that was taken out on this home.
Original Mortgage
$67,199
Interest Rate
6.25%
Purchase Details
Closed on
Jun 23, 2003
Sold by
Farm Equites Inc
Bought by
Yee Maurine
Home Financials for this Owner
Home Financials are based on the most recent Mortgage that was taken out on this home.
Original Mortgage
$60,032
Interest Rate
5.16%
Mortgage Type
New Conventional
Create a Home Valuation Report for This Property
The Home Valuation Report is an in-depth analysis detailing your home's value as well as a comparison with similar homes in the area
Home Values in the Area
Average Home Value in this Area
Purchase History
| Date | Buyer | Sale Price | Title Company |
|---|---|---|---|
| Gomez Francisco J | -- | -- | |
| Gomez Francisco J | $100,000 | -- | |
| Artisan Home Builders Group Inc | $88,000 | -- | |
| Yee Maurine | $64,900 | -- |
Source: Public Records
Mortgage History
| Date | Status | Borrower | Loan Amount |
|---|---|---|---|
| Open | Gomez Francisco J | $300,000 | |
| Previous Owner | Artisan Home Builders Group Inc | $67,199 | |
| Previous Owner | Yee Maurine | $60,032 |
Source: Public Records
Tax History Compared to Growth
Tax History
| Year | Tax Paid | Tax Assessment Tax Assessment Total Assessment is a certain percentage of the fair market value that is determined by local assessors to be the total taxable value of land and additions on the property. | Land | Improvement |
|---|---|---|---|---|
| 2025 | $12,113 | $395,520 | $68,200 | $327,320 |
| 2024 | $11,153 | $333,600 | $57,600 | $276,000 |
| 2023 | $11,153 | $333,600 | $57,600 | $276,000 |
| 2022 | $11,134 | $333,600 | $57,600 | $276,000 |
| 2021 | $8,829 | $237,400 | $37,200 | $200,200 |
| 2020 | $8,886 | $237,400 | $37,200 | $200,200 |
| 2019 | $8,560 | $237,400 | $37,200 | $200,200 |
| 2018 | $8,584 | $237,400 | $37,200 | $200,200 |
| 2016 | $6,617 | $180,840 | $30,000 | $150,840 |
| 2015 | $6,690 | $180,840 | $30,000 | $150,840 |
| 2014 | -- | $170,840 | $30,000 | $140,840 |
Source: Public Records
Map
Nearby Homes
- 4728 Ardmore Ln
- 4727 Ardmore Ln
- 1576 Maston Rd
- 1543 Maston Rd
- 1431 Winding Ridge Trail
- 4828 Ardmore Ln
- 1011 Ardmore Trail
- 29 Hydrangea Way Unit 72
- 951 Ardmore Tr
- 5689 Wheeler Ridge Rd
- 940 Chateau Forest Rd
- 5599 Wheeler Ridge Rd
- 4525 Legacy Ct
- 5747 Wheeler Rd
- 1376 Beringer Dr
- 2030 Havenhurst Way
- 2134 Woodmarsh Cir
- 1351 Ashbury Park Way E
- 1271 Harvest Ln
- 1203 Vintage Way
- 4768 Ardmore Ln
- 4748 Ardmore Ln
- 1065 Chateau Forest Rd
- 4728 Ardmore Ln NE
- 4778 Ardmore Ln
- 4777 Ardmore 0
- 1055 Chateau Forest Rd
- 1060 Chateau Forest Rd
- 1060 Chateau
- 4787 Ardmore Ln
- 1050 Chateau Forest Rd
- 1045 Chateau Forest Rd
- 1042 Ardmore Ln NE
- 4787 Ardmore Ln NE
- 4777 Ardmore Ln NE
- 4837 Ardmore Ln NE
- 4754 Ardmore Ln NE
- 4848 Ardmore Ln NE
- 0 Ardmore Ln NE Unit 8093965
- 0 Ardmore Ln NE Unit 7225376