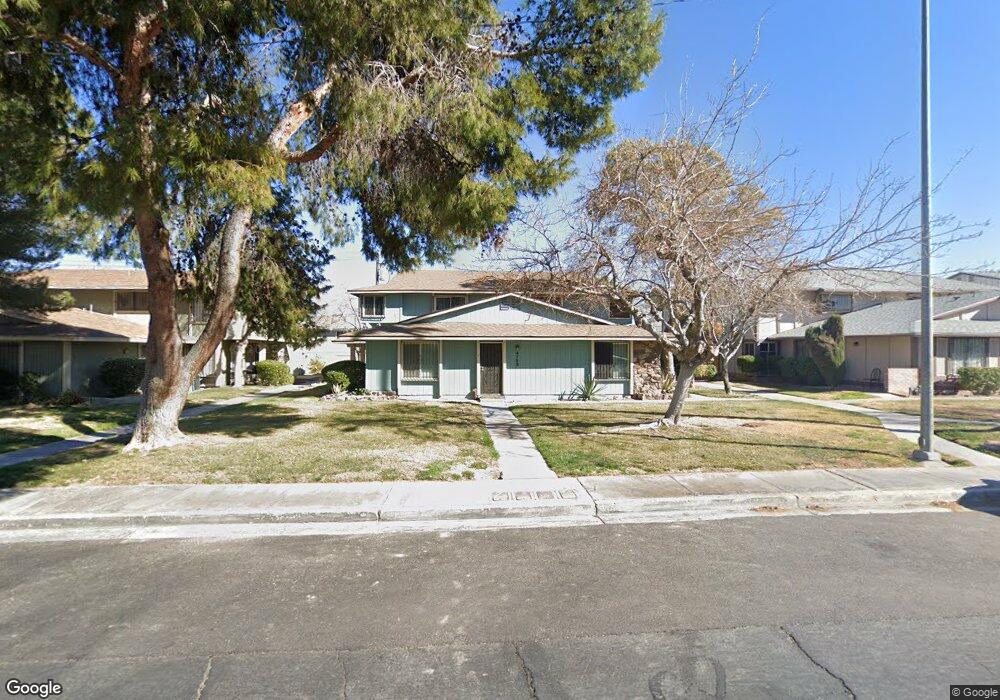
4758 Roberta St Unit 1 Las Vegas, NV 89119
University District NeighborhoodEstimated Value: $199,000 - $225,000
2
Beds
2
Baths
1,064
Sq Ft
$200/Sq Ft
Est. Value
About This Home
This home is located at 4758 Roberta St Unit 1, Las Vegas, NV 89119 and is currently estimated at $212,307, approximately $199 per square foot. 4758 Roberta St Unit 1 is a home located in Clark County with nearby schools including Lewis E Rowe Elementary School, William E. Orr Middle School, and Del Sol Academy of the Performing Arts.
Ownership History
Date
Name
Owned For
Owner Type
Purchase Details
Closed on
Aug 20, 2018
Sold by
Torres Luz
Bought by
Torres Rafael and Torres Luz M
Current Estimated Value
Purchase Details
Closed on
May 28, 2013
Sold by
Olson Lane A
Bought by
Torrez Luz
Purchase Details
Closed on
Jan 28, 2003
Sold by
Jette Ariel C and Jette Ruth B
Bought by
Olson Lane A
Home Financials for this Owner
Home Financials are based on the most recent Mortgage that was taken out on this home.
Original Mortgage
$56,000
Interest Rate
5.97%
Purchase Details
Closed on
Feb 13, 2001
Sold by
Sardo Nicholas F
Bought by
Jette Ariel C and Jette Ruth B
Home Financials for this Owner
Home Financials are based on the most recent Mortgage that was taken out on this home.
Original Mortgage
$56,400
Interest Rate
7.06%
Mortgage Type
FHA
Purchase Details
Closed on
Jan 7, 1999
Sold by
Holbrook Royal A
Bought by
Sardo Ii Nicholas F
Create a Home Valuation Report for This Property
The Home Valuation Report is an in-depth analysis detailing your home's value as well as a comparison with similar homes in the area
Home Values in the Area
Average Home Value in this Area
Purchase History
| Date | Buyer | Sale Price | Title Company |
|---|---|---|---|
| Torres Rafael | -- | None Available | |
| Torrez Luz | $69,600 | None Available | |
| Olson Lane A | -- | Land Title Of Nevada | |
| Jette Ariel C | $70,500 | Old Republic Title Company | |
| Sardo Ii Nicholas F | $62,000 | Old Republic Title Company |
Source: Public Records
Mortgage History
| Date | Status | Borrower | Loan Amount |
|---|---|---|---|
| Previous Owner | Olson Lane A | $56,000 | |
| Previous Owner | Jette Ariel C | $56,400 |
Source: Public Records
Tax History Compared to Growth
Tax History
| Year | Tax Paid | Tax Assessment Tax Assessment Total Assessment is a certain percentage of the fair market value that is determined by local assessors to be the total taxable value of land and additions on the property. | Land | Improvement |
|---|---|---|---|---|
| 2025 | $675 | $24,849 | $15,050 | $9,799 |
| 2024 | $626 | $24,849 | $15,050 | $9,799 |
| 2023 | $626 | $31,835 | $22,750 | $9,085 |
| 2022 | $580 | $25,073 | $16,450 | $8,623 |
| 2021 | $537 | $24,401 | $15,750 | $8,651 |
| 2020 | $496 | $24,256 | $15,400 | $8,856 |
| 2019 | $464 | $20,983 | $11,900 | $9,083 |
| 2018 | $443 | $16,057 | $7,000 | $9,057 |
| 2017 | $8,803 | $15,797 | $6,300 | $9,497 |
| 2016 | $416 | $14,106 | $4,200 | $9,906 |
| 2015 | $414 | $14,105 | $4,200 | $9,905 |
| 2014 | $414 | $15,805 | $5,075 | $10,730 |
Source: Public Records
Map
Nearby Homes
- 1481 Lorilyn Ave Unit 1
- 1521 Elizabeth Ave Unit 4
- 1454 Elizabeth Ave Unit 3
- 1407 Dorothy Ave Unit 3
- 1393 Dorothy Ave Unit 1
- 1433 Santa Anita Dr Unit D
- 1467 Hialeah Dr Unit D
- 1500 Hialeah Dr Unit C
- 1500 Hialeah Dr Unit A
- 1569 Hialeah Dr
- 1337 Dorothy Ave Unit 3
- 1511 Living Desert Dr Unit C
- 1321 Lorilyn Ave Unit 1
- 1375 Hialeah Dr Unit C
- 1309 Dorothy Ave Unit 2
- 1307 Lorilyn Ave Unit 1
- 1400 Hialeah Dr Unit B
- 1321 Del Mar St Unit 4
- 5015 Spencer St Unit C
- 1675 Jupiter Ct Unit C
- 4758 Roberta St Unit 3
- 4758 Roberta St Unit 4
- 4758 Roberta St Unit 2
- 4758 Roberta St Unit 3
- 4746 Roberta St Unit 3
- 4746 Roberta St Unit 1
- 4746 Roberta St Unit 4
- 4746 Roberta St Unit 2
- 4770 Roberta St
- 4770 Roberta St Unit 2
- 4770 Roberta St Unit 4
- 4770 Roberta St Unit 1
- 4770 Roberta St Unit 3
- 4734 Roberta St Unit 2
- 4734 Roberta St Unit 4
- 4734 Roberta St Unit 1
- 4734 Roberta St Unit 3
- 4782 Roberta St Unit 4
- 4782 Roberta St Unit 3
- 4782 Roberta St Unit 2